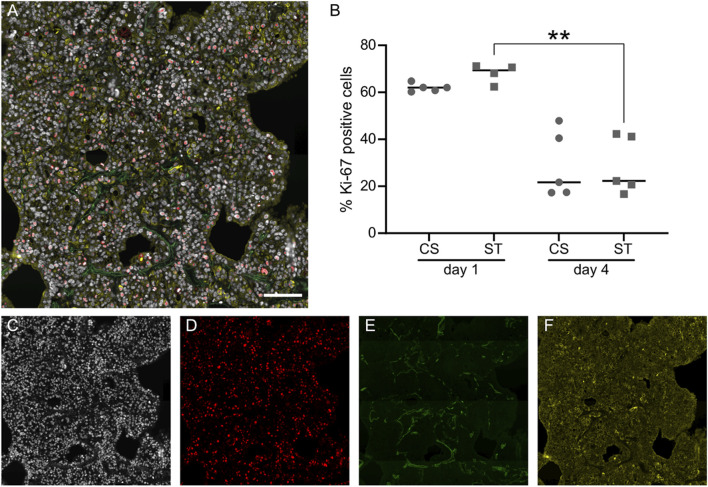
FIGURE 3.
Evaluation of cell proliferation with Ki-67 staining and quantification. Representative image of lung slices stained against Ki-67 (red), epithelial marker pan-cytokeratin (yellow) and nuclei (DAPI, white), while autofluorescence at 495/519 nm (FITC) was used to visualize ECM fibers in the lung slice (A). Quantification of Ki-67 in cell nuclei expressed as proportion of positive cell nuclei (B), data points represent data from individual lung slice samples, horizontal lines show group median. Individual channels from (A) are shown in (C–F). Scale bar is 100 μm, CS: cyclic stretch (circles), ST: static culture (squares), **: p-value < 0.01.

