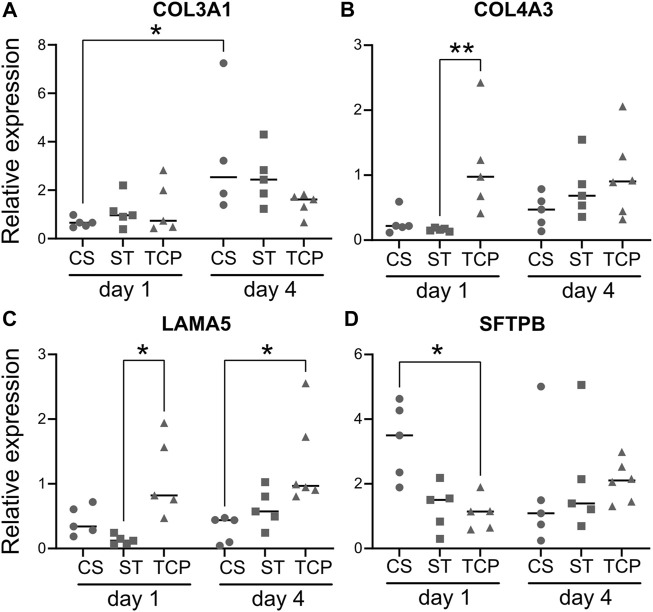
FIGURE 5.
Quantitative PCR analysis of the expression of ECM and surfactant genes. Gene expression results for collagen type III α1 chain (COL3A1, (A), collagen type IV α3 chain (COL4A3, (B), laminin α5 (LAMA5, (C) and surfactant protein B (SFTPB, (D) for the H441 epithelial cells cultured in the different conditions tested. Data is presented as relative expression compared to TCP at day 1, with individual points (biological replicates or “n”) together with the median. CS: cyclic stretch (circles), ST: static culture (squares), TCP: tissue culture plastic (triangles), *: p < 0.05. n = 5 for every gene for CS and ST, except for CS at day 4 for COL3A1 (n = 4). n = 3 for TCP in every case.

