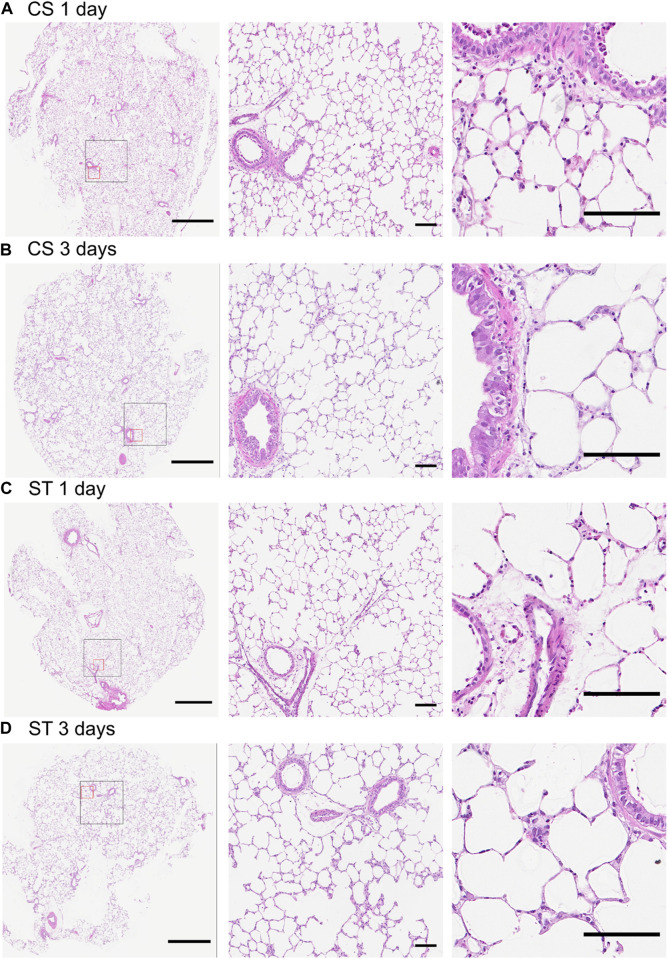
FIGURE 7.
Hematoxylin and eosin staining of PCLS cultured under cyclic stretch or static conditions. Representative images of stained sections exposed to cyclic stretch (CS) for 1 (A) and 3 days (B) and static controls (ST) at these same timepoints ((C,D), respectively), including overview (left) and higher magnification (center and right) images. The black and red squares in the overview image are displayed in higher magnification to the right of the overview. Samples were retrieved after 1 and 3 days of stretch (2 and 4 days after slicing). Stained sections from two technical replicates from each experiment (n = 3) and timepoint were evaluated. No difference between the timepoints nor between CS and ST groups were seen in morphological assessment focusing on cell shrinkage and pyknotic bodies as signs of apoptosis. Scale bar is 1 mm for the overview images (left) and 100 µm for the higher magnification ones (center and right).

