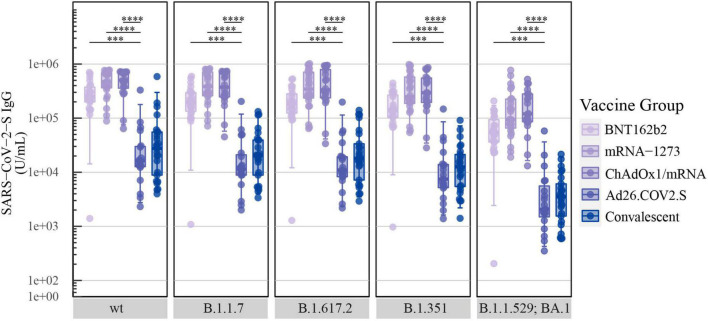
FIGURE 1.
Levels of SARS-CoV-2-S IgG after COVID-19 vaccination: Levels of total SARS-CoV-2-S IgG in U/mL induced by primary COVID-19 vaccination with BNT162b2 (n = 22), mRNA-1273 (n = 24), ChAdOx1/mRNA (n = 20) or Ad26.COV2.S (n = 19) quantified by the MSD platform (serum 1:5,000). Data from convalescent comparators (n = 25) are also displayed, but are not included in the statistical analysis. From left to right: SARS-CoV-2-S wt (Wuhan-Hu-1) and the following SARS-CoV-2-S VOCs: B.1.1.7 (Alpha), B.1.617.2 (Delta), B.1.351 (Beta) and B.1.1.529; BA.1 (Omicron). The boxplots present the lower quartile, median and upper quartile, and the error bars indicate 95% CI. P-values were indicated as follows: ***p < 0.001 and ****p < 0.0001.

