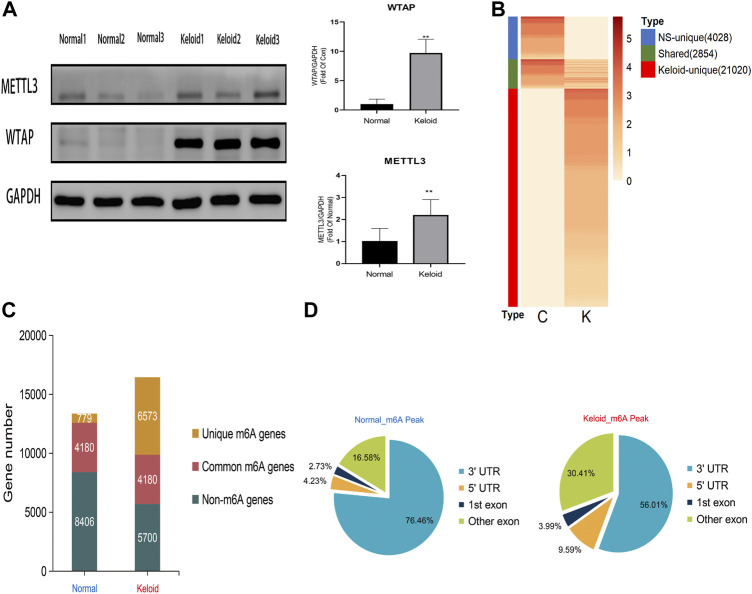
FIGURE 1.
Transcriptome wide of MERIP-seq and the distribution of m6A peaks in the keloid tissue and in the normal skin tissue. (A) Protein level of the METTL3 and WTAP methyltransferases in two types of tissues. n = 3 samples were randomly selected from each group in the WB experiments, *p < 0.05. (B) Signal heatmaps of unique and shared m6A peaks between the keloid and normal skin. The signal was presented with the value of log2 fold change of the distinct m6A peak sets. (C) Summary of m6A-modified genes identified in both groups. (D) Distribution of m6A peaks in the genic regions of the two groups.

