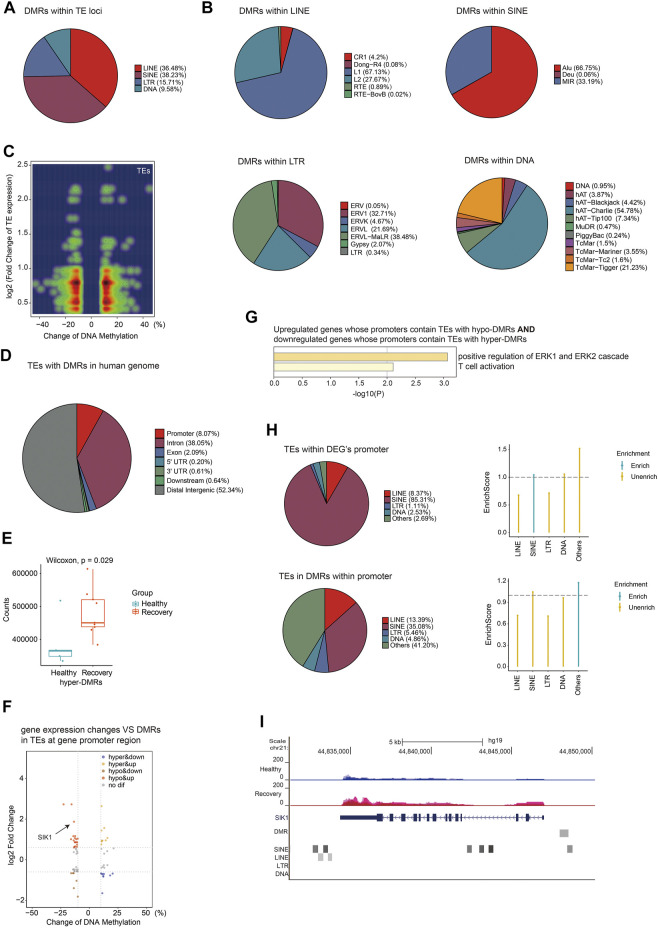
FIGURE 7.
Aberrant DNA methylation at TE loci may be involved in gene regulation. (A) Pie chart demonstrates distribution of DMRs in TE subfamilies. (B) Pie chart demonstrates distribution of DMRs in LINE/SINE/LTR/DNA transposons. (C) Density scatter plot demonstrates relationship between DNA methylation differences of TEs and their expression differences. (D) Pie chart (without annotation of TEs) demonstrates distribution of TEs with DMRs in human genome. (E) Calculation of total gene counts adjacent to TEs with hyper-DMRs in healthy and recovery group. The median, first, and third quartiles are shown in boxplots. Two-sided Wilcoxon signed-rank test were used for all the comparisons. (F) Scatter plot of the relationship between DNA methylation differences at TEs and expression differences of genes with promoters containing TEs with DMRs. (G) Functional enrichment of upregulated/downregulated genes whose promoters contain TEs with hypo/hyper-DMRs by Metascape. (H) The upper pie chart demonstrates the distribution of TEs overlapped with DEG`s promoters in TE subfamilies. Enrich score was calculated by (TE subfamily ratio of TEs overlapped with DEG`s promoters)/(TE subfamily ratio of TEs overlapped with all gene`s promoters). The bottom pie chart shows the distribution of DMRs overlapped with gene`s promoters in TE subfamilies. Enrich score was calculated by (TE subfamily ratio of DMRs overlapped with gene`s promoters)/(TE subfamily ratio of gene promoters). Sliding windows was made across gene promoters with 500 bps consistent with our call DMR strategy. Chi-square tests was used for statistics, enrichment score >1 and p-value < 0.05 was defined as enrichment. (I) UCSC genome browser view of RNA-seq data demonstrated increased SIK1 expression in recovery group and position of hypo-DMR in SIK1 promoter.

