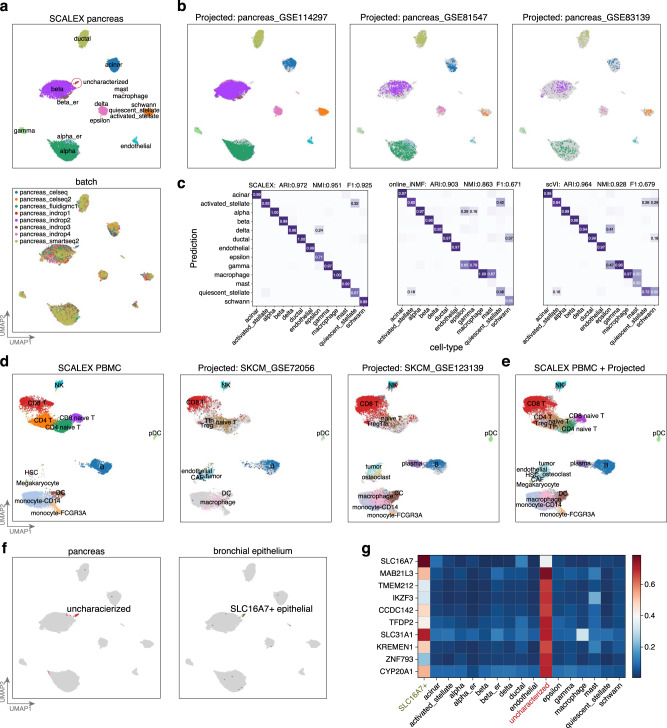
Fig. 3. Projecting heterogenous data into a common cell-embedding space.
a UMAP embeddings of the pancreas dataset after integration by SCALEX, colored by cell-type and by batch. b UMAP embeddings of the common cell space obtained by using SCALEX to project three additional indicated pancreas data batches onto the pancreas dataset. Cells are colored by cell-type with light gray shadows representing the original pancreas dataset. c Confusion matrix between ground truth cell-types and those annotated by different methods. ARI, NMI and F1 scores (top) measure the annotation accuracy. d UMAP embeddings of the common space obtained by using SCALEX to project the two projected melanoma data batches onto the PBMC dataset, colored by cell-types with light gray shadows represent the original PBMC dataset. e UMAP embeddings of the common cell space that includes the original PBMC dataset and the two projected melanoma data batches. f Annotating an uncharacterized small cell population in the pancreas dataset by projection of the bronchial epithelium data batches into the pancreas cell space. Only the uncharacterized cells in the pancreas dataset (left) and the SLC16A7+ epithelial cells in the bronchial epithelium data batches (right) are colored. g Heatmap showing the normalized expression of the top-10 ranking specific genes for the uncharacterized cell population in different cell-types.

