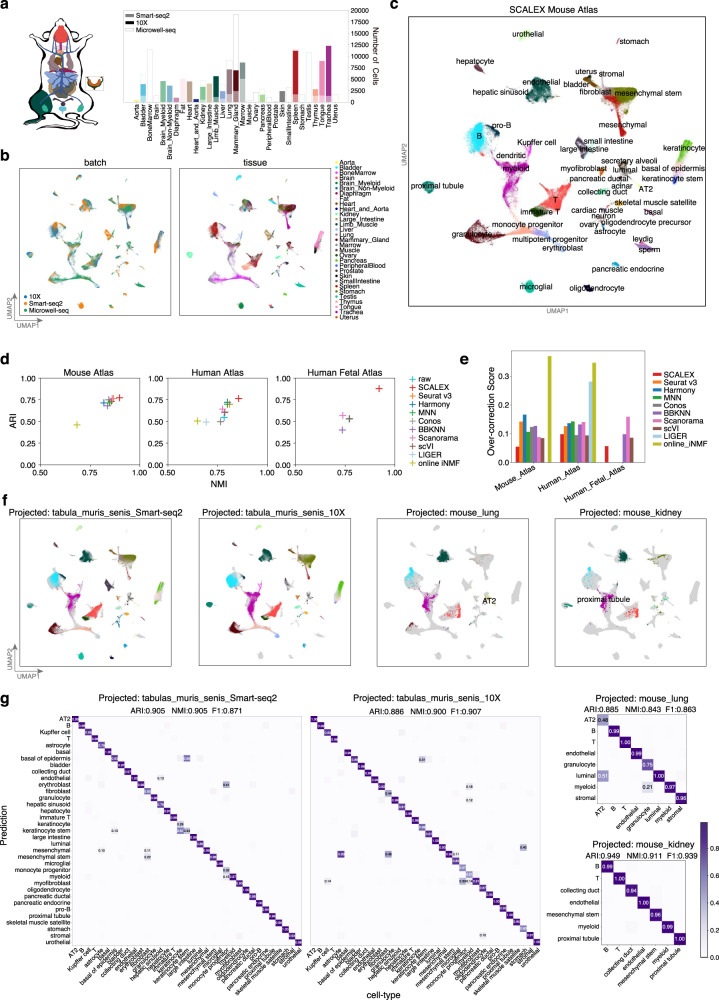
Fig. 4. Construction of an expandable mouse single-cell atlas.
a Datasets acquired using different technologies (Smart-seq2, 10X, and Microwell-seq) covering various tissues used for construction of the mouse atlas. b UMAP embeddings of the Mouse Atlas dataset colored by batch and tissue. c UMAP embeddings of the Mouse Atlas after SCALEX integration, colored by cell-type. d Scatter plot showing a quantitative comparison of the ARI score (y-axis) and the NMI score (x-axis) based-on the Leiden clustering results on the latent space based on the Human Atlas, Mouse Atlas, and Human Fetal Atlas datasets. e Comparison of over-correction score by the indicated methods based on the Human Atlas, Mouse Atlas, and Human Fetal Atlas datasets. f UMAP embeddings of the common cell space obtained by using SCALEX to project the two Tabula Muris Senis data batches and two mouse tissues (lung and kidney) data batches onto the Mouse Atlas dataset. Cells are colored by cell-type with light gray shadows representing the original Mouse Atlas dataset. g Confusion matrix of the cell-type annotations by SCALEX and those in the original studies. Color bar represents the percentage of cells in confusion matrix Cij known to be cell-type i and predicted to be cell-type j.

