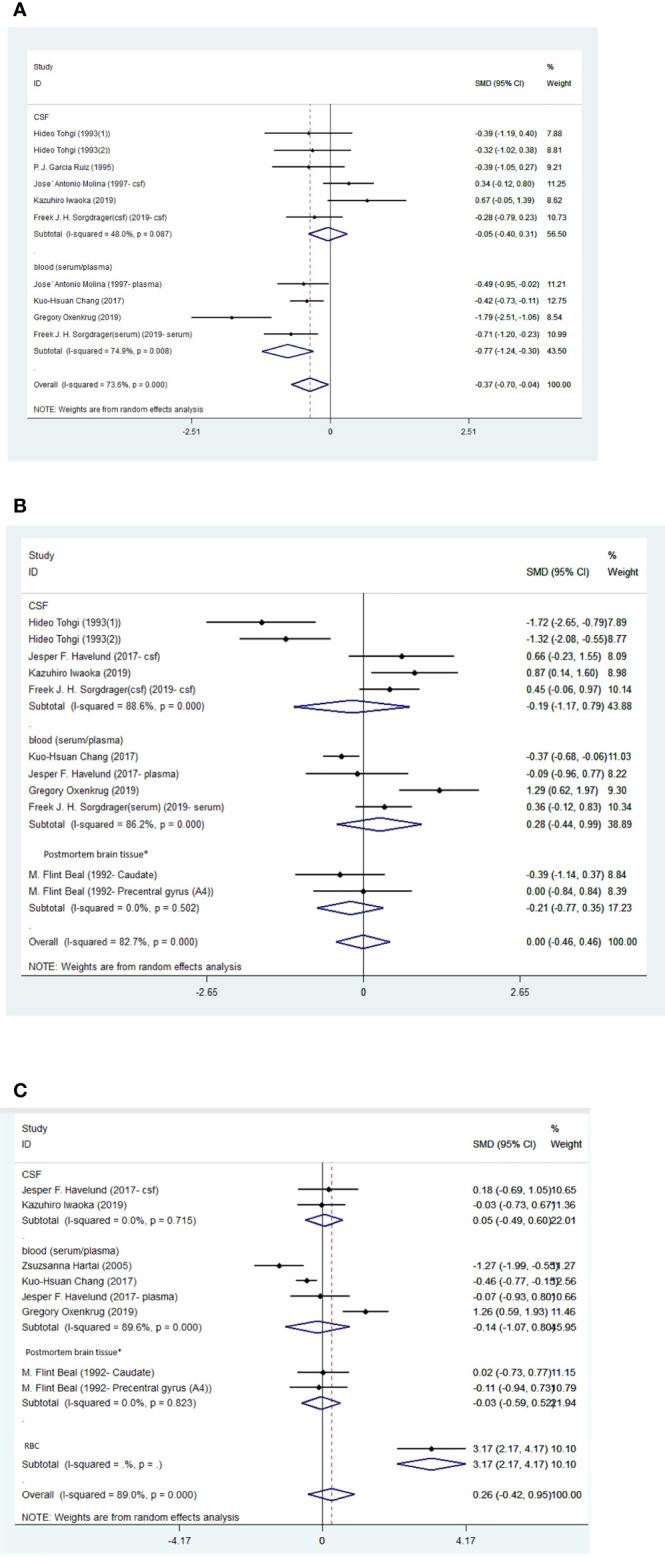
Figure 5.

(A) Forest plot of the levels of TRP in PD patients. In this plot, the squares are applied to show the mean effect estimate of each paper along with their 95% CI. The size of each square is considered proportional to the weight of the parameter in the meta-analysis, and is also demonstrated in a separate column. (B). Forest plot of the levels of KYN in PD patients. In this plot, the squares are applied to show the mean effect estimate of each paper along with their 95% CI. The size of each square is considered proportional to the weight of the parameter in the meta-analysis, and is also demonstrated in a separate column. *caudate nucleus or precentral gyrus. (C) Forest plot of the levels of KYNA in PD patients. In this plot, the squares are applied to show the mean effect estimate of each paper along with their 95% CI. The size of each square is considered proportional to the weight of the parameter in the meta-analysis, and is also demonstrated in a separate column. *caudate nucleus or precentral gyrus.
