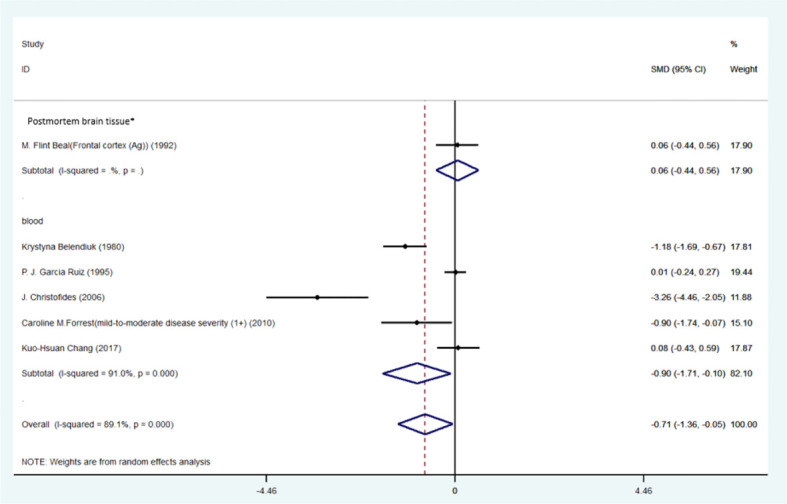
Figure 6.

Forest plot of the levels of TRP in HD patients. In this plot, the squares are applied to show the mean effect estimate of each paper along with their 95% CI. The size of each square is considered proportional to the weight of the parameter in the meta-analysis, and is also demonstrated in a separate column. *frontal cortex.
