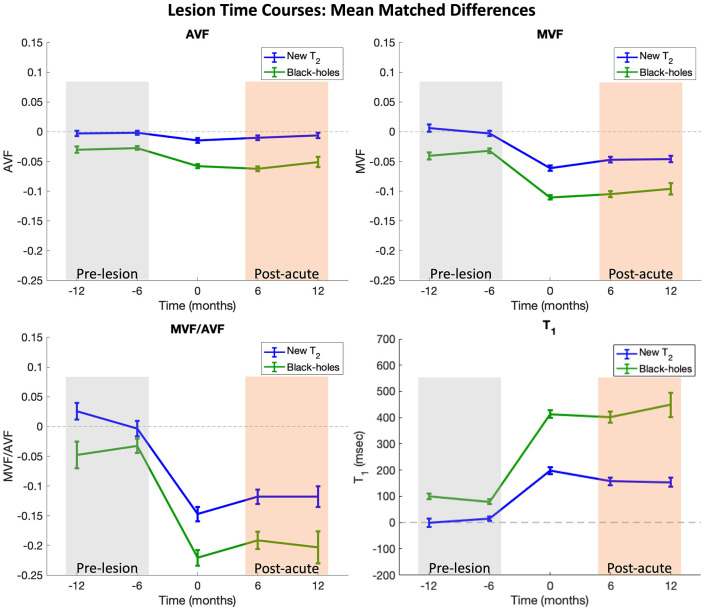
Figure 3.
Time course plots. Time course plots represent mean differences between lesion ROIs and matched contralateral NAWM ROIs. Contralateral ROIs were masked to remove non-WM tissue (i.e. cortex, lesion, cerebrospinal fluid) and were subsequently manually adjusted to maintain consistent ROI volume. Time courses were shifted in time such that Time 0 corresponds to the first time each lesion was observed on MRI. Lesions containing clusters of at least 8 connected voxels with T1 > 1600 ms at the last imaging timepoint were classified as black-hole lesions (plotted in green). Bars represent the standard errors. Pre-lesion and post-acute values are calculated for each lesion by averaging all available timepoints in the gray- and orange-shaded boxes, respectively.

