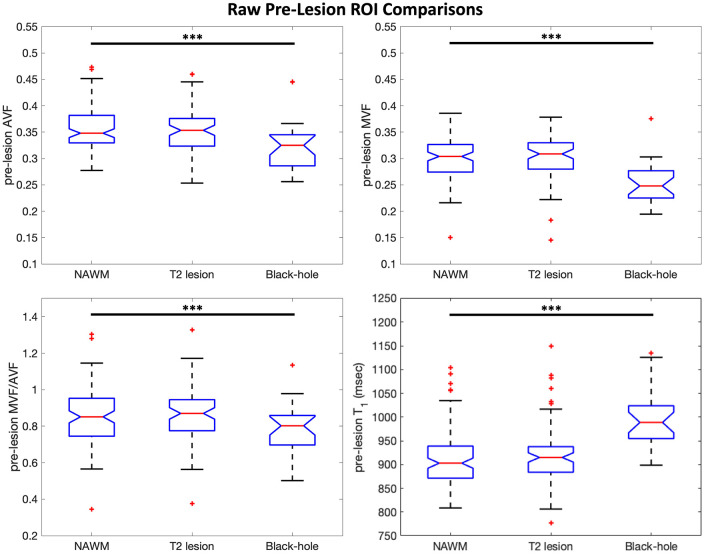
Figure 4.
Pre-lesion boxplots. Boxplots comparing pre-lesion values (calculated for each ROI by averaging all available timepoints in the Figure 3 gray-shaded boxes) between lesion ROIs and contralateral NAWM ROIs matched in size and homologous location to each lesion ROI. Pre-lesion MVF, AVF, MVF/AVF, and T1 in black-hole lesions are significantly different from contralateral NAWM. Mixed-effects models were used to calculate p-values and significance was set at the 0.05 level. Outliers are indicated by red + symbols.
***p < 0.001.

