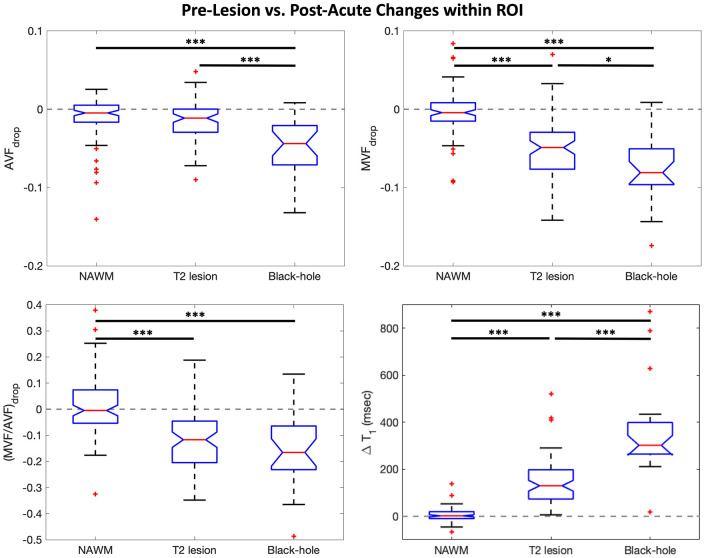
Figure 5.
Parameter change boxplots. Boxplots illustrating parameter change for each lesion type and NAWM (i.e. MVFdrop = post-acute MVF − pre-lesion MVF). On average, NAWM ROIs showed no significant change over time. Aside from AVF in non-BH lesions, all other signals showed longitudinal changes that were significantly greater than in contralateral NAWM ROIs matched in size and homologous location to each lesion ROI. Recovery in BH lesions was substantially attenuated compared to non-BH lesions: MVF and AVF were significantly decreased, and T1 was significantly increased (p < 0.001 for all comparisons). Interestingly, (MVF/AVF)drop was not different between BH and non-BH lesions. Mixed-effects models were used to calculate p-values and significance was set at the 0.05 level. Outliers are indicated by red + symbols.
*p < 0.05; ***p < 0.001.

