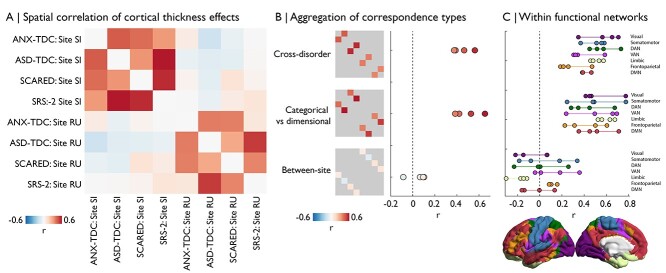
Figure 3.
Comparison and aggregation of spatial maps. (A) The matrix depicts the spatial correlation of case–control and dimensional maps across sites. (B) Labeling the cross-correlation estimates by analysis type, we can observe consistency of cross-disorder similarities and categorical-vs-dimensional approaches, whereas similarities across sites are consistently low. (C) Cross-correlations performed within functional network (Yeo et al. 2011), organized by type. DAN = dorsal attention network. VAN = ventral attention network. DMN = default mode network.

