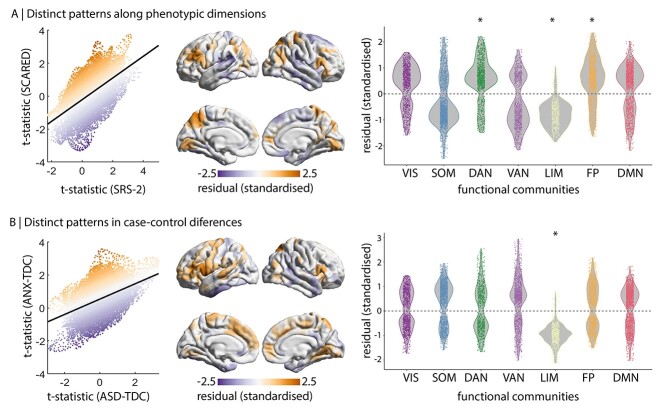
Figure 4.
Distinct cortical thickness signatures within functional networks. Left correspondence of t-statistic maps for site 1, colored by standardized residuals. Centre averaged, consistency-thresholded standardized residuals, taken across both sites. Right residual stratified by functional networks (Yeo et al. 2011). *Pspin < 0.05. VIS = visual. SOM = somatomotor. DAN = dorsal attention network. VAN = ventral attention network. LIM = limbic. FP = frontoparietal. DMN = default mode network. (A) Comparison of SRS-2 and SCARED maps. (B) Comparison of ASD-TDC and ANX-TDC maps.

