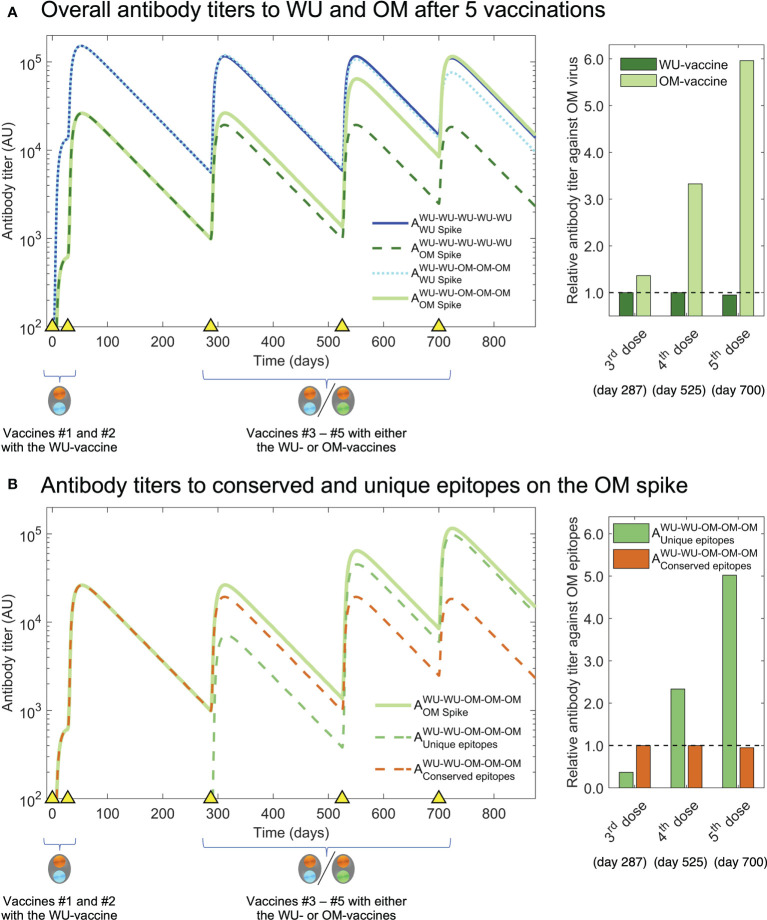
Figure 4.
Simulation of third and fourth boosts with the OM-vaccine show generation of higher titers to OM antigen than boosting with the WT-vaccine. (A) We plot antibody titers to WU and OM (subscripts) after WU-WU-WU-WU-WU and WU-WU-OM-OM-OM vaccinations. Titers to OM are similar after vaccination #3 with the WU-vaccine and OM-vaccine (solid light green and dashed dark green lines). However, a further vaccination #4 results in substantially higher antibody titers to OM when the OM-vaccine is used rather than the WU-vaccine (compare solid light green and dashed dark green lines). The bar graph at the right shows that vaccinations #3-#5 with the OM-vaccine (light green bars) result in much higher antibody titers to OM compared to when the WU-vaccine is used (dark green bars). (B) We plot antibody titers to the OM-specific versus conserved epitopes following WU-WU-OM-OM-OM vaccination. The overall increase in titers to OM (light green line) following vaccinations #4 & #5 arises from increases in the OM-specific antibody titer (dashed green line) and responses to the conserved epitopes do not increase (dashed brown line). This is shown in the bar-plot to the right where we see the antibody titer to the OM-specific epitopes (green bars) and shared epitopes (brown bars).

