. 2022 Sep 6;82(20):3845–3857. doi: 10.1158/0008-5472.CAN-21-4140

Figure 4.

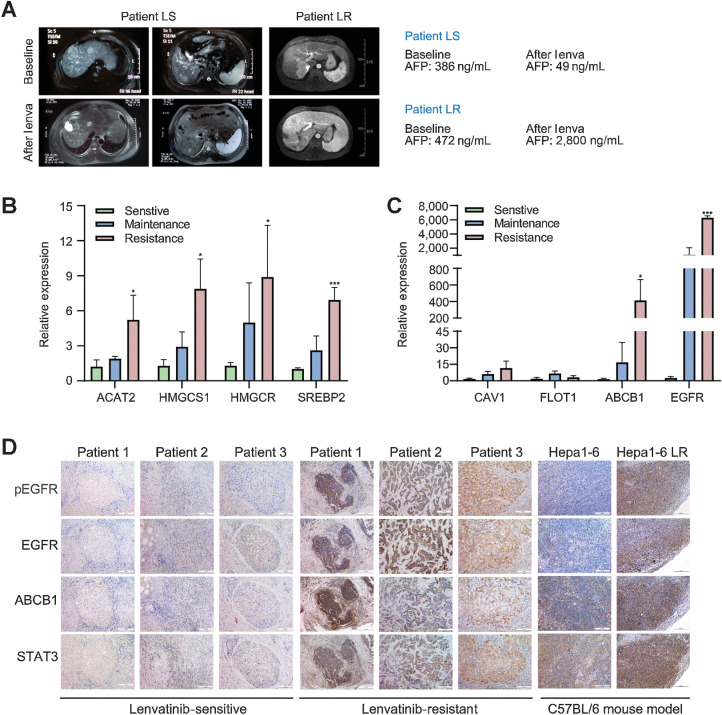
Figure 4. Activation of the EGFR–STAT3–ABCB1 pathway is validated in LR patients and the Hep 1–6 LR mouse model. The efficacy of lenvatinib treatment was evaluated according to RECIST1.1 criteria. In the preoperative efficacy evaluation, patients who reached PD were considered resistant to lenvatinib, and patients who reached PR or SD were considered sensitive to lenvatinib. A, Comparison of liver MRI images and AFP values before and after lenvatinib treatment between a patient in the sensitive group and a patient in the resistant group. B and C, Tissues from patients who reached PR, SD, and PD after lenvatinib treatment were used for validation at the mRNA level. D, IHC staining of liver cancer tissues from patients in the sensitive group and resistant group, and subcutaneous tumor tissues derived from mice that were implanted with the Hep1–6 and Hep1–6 LR strains. All the results are shown as the mean ± SD (n = 5). Two-way ANOVA was used to analyze the data. *, P < 0.05; **, P < 0.01; ***, P < 0.001; ****, P < 0.0001.

Activation of the EGFR–STAT3–ABCB1 pathway is validated in LR patients and the Hep1–6 LR mouse model. The efficacy of lenvatinib treatment was evaluated according to RECIST1.1 criteria. In the preoperative efficacy evaluation, patients who reached PD were considered resistant to lenvatinib, and patients who reached PR or SD were considered sensitive to lenvatinib. A, Comparison of liver MRI images and AFP values before and after lenvatinib treatment between a patient in the sensitive group and a patient in the resistant group. B and C, Tissues from patients who reached PR, SD, and PD after lenvatinib treatment were used for validation at the mRNA level. D, IHC staining of liver cancer tissues from patients in the sensitive group and resistant group, and subcutaneous tumor tissues derived from mice that were implanted with the Hep1–6 and Hep1–6 LR strains. All the results are shown as the mean ± SD (n = 5). Two-way ANOVA was used to analyze the data. *, P < 0.05; ***, P < 0.001.