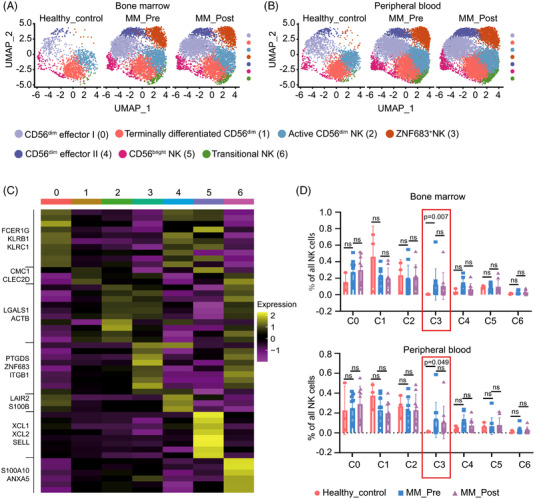
FIGURE 1.

Single‐cell transcriptome profiles of NK cells from MM patients and healthy volunteers‐derived BM/PB samples. (A and B) Uniform Manifold Approximation and Projection (UMAP) visualization of 30,008 single NK cells from healthy volunteers (Healthy_control, n = 3), MM patients before treatment (MM_Pre, n = 10), and after treatment (MM_Post, n = 9). NK cells from both BM (A) and PB (B) are colour‐coded and divided into seven clusters according to the expression levels of marker genes. (C) Marker gene analyses identify heterogeneous clusters as CD56dim effector I NK, terminally differentiated CD56dim NK, active CD56dim NK, ZNF683+ NK, CD56dim effector II NK, CD56bright NK, and transitional NK. Expression of the top marker genes for each cluster is depicted as heatmap. (D) The percentages of each NK cluster in total NK cells of BM samples (upper panel) and PB samples (lower panel)
