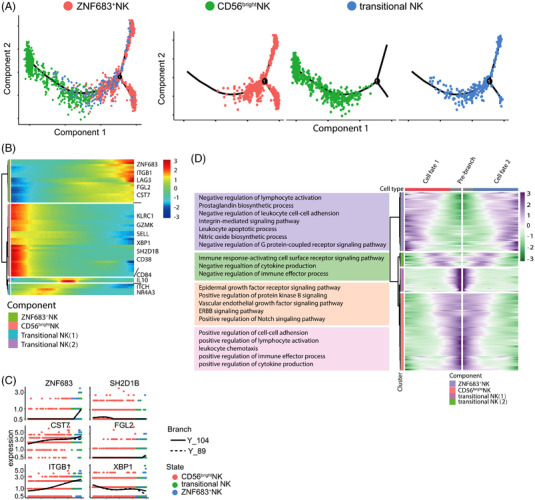
FIGURE 5.

Gene expression dynamics along the pseudotime of NK cell exhaustion. (A) pseudotime trajectory analysis of ZNF683+NK cells, transitional NK cells and CD56bright NK cells with high variable genes. Each dot represents one single cell, colour‐coded according to its cluster label. The integrated diffusion maps of clusters of NK cells reveal a developmental trajectory with conserved ‘pseudo‐temporal’ dynamics. (B) Heatmap depicting expression of state‐specific markers obtained by monocle. (C) Gene expression variation in ZNF683+NK cells relative to immature NK cells were shown. (D) Heatmap show GO analysis results of state‐specific signalling pathways along the pseudo‐time
