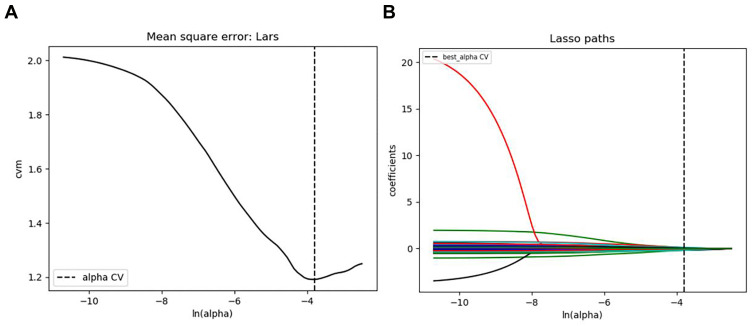
Figure 2.
The LASSO regression model was used to select radiomics features. (A) LASSO coefficient profiles of the 26 radiomics features. A coefficient profile plot was generated versus the selected log (λ) value using ten-fold cross-validation, where optimal λ resulted in 8 features with nonzero coefficients. (B) The 26 radiomics features’ LASSO coefficient profiles. The log (λ) sequence was used to create a coefficient profile plot. Using 10-fold cross-validation, the dotted vertical line was drawn at the value chosen.

