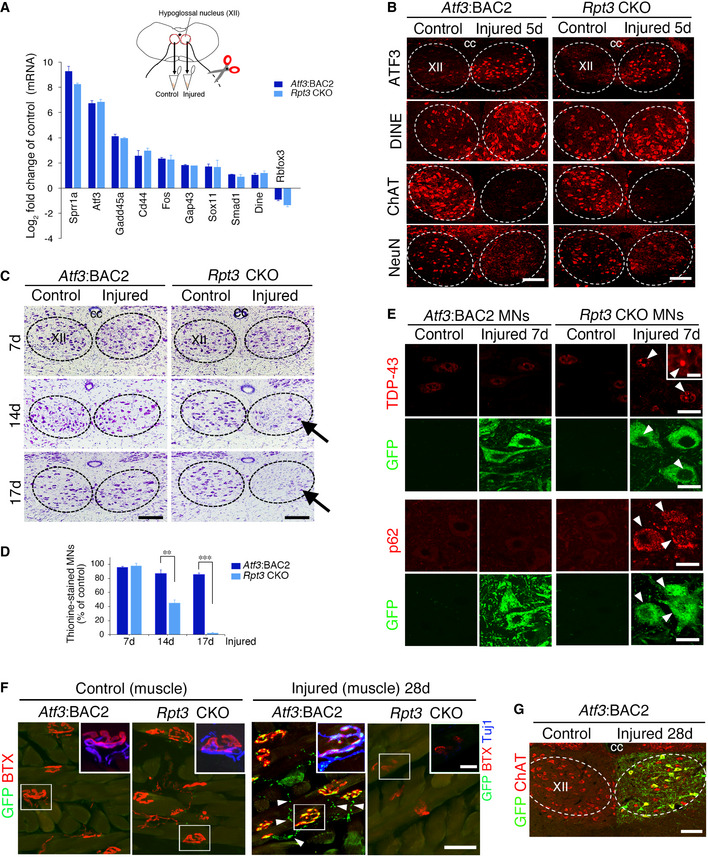
Figure 2. Injury‐induced Rpt3‐ablated motor neurons show regenerative responses but degenerate.

- The fold change in the mRNA expression of regeneration‐associated genes (RAGs) in injured hypoglossal nuclei compared with control hypoglossal nuclei of Atf3:BAC2 Tg and Rpt3 CKO mice at 5 days following nerve injury. Data are shown as the mean ± s.e.m. Fold changes in RAGs before and after injury have no significance between Atf3:BAC2 Tg and Rpt3 CKO mice, determined by unpaired t‐test (3 independent experiments).
- The expression of representative regeneration‐associated proteins is properly up‐ or downregulated in injured motor neurons of Rpt3 CKO mice at 5 days following hypoglossal nerve injury.
- Thionine‐stained motor neurons of Atf3:BAC2 Tg and Rpt3 CKO mice at 7, 14, and 17 days after hypoglossal nerve axotomy. Arrows indicate the loss of motor neurons.
- The graph showing the percentage of surviving motor neurons on the injured side compared with that on the control side. Data are shown as the mean ± s.e.m. (**P = 0.0002, ***P < 0.0001, determined by unpaired t‐test, n = 5 mice per group at each time point).
- The P62‐ and TDP‐43 positive immunostaining in control and injured motor neurons (MNs) of Atf3:BAC2 Tg and Rpt3 CKO mice at 7 days after hypoglossal nerve axotomy. Arrowheads show injured MNs with the accumulated proteins.
- Regenerating axons and neuromuscular junction (NMJ) in tongue of Atf3:BAC2 Tg and Rpt3 CKO mice. Arrowheads show GFP‐labeled mitochondria in regenerating motor axons to reform NMJ. The boxed region is magnified in inset, showing GFP‐labeled mitochondria, axon (Tuj1) and α‐Bungarotoxin (BTX).
- Immunostaining of ChAT and GFP‐positive motor neurons of Atf3:BAC2 Tg mouse at 28 days after hypoglossal nerve injury.
Data information: Dashed lines outline hypoglossal nucleus in (B, C, and G). XII, hypoglossal nucleus; cc, central canal. Scale bars, 150 μm in (B and C), 100 μm in (G), 20 μm in (E and F), 10 μm in (F inset), and 5 μm in (E inset).
Source data are available online for this figure.
