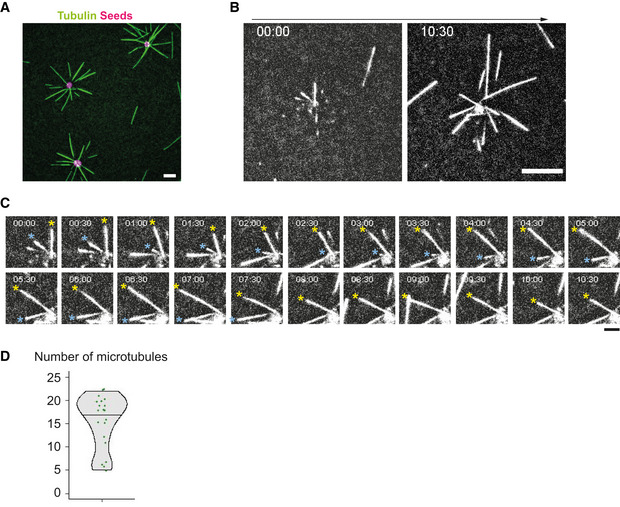
Figure EV1. Characterization of an artificial MTOC.

- Observation of MT aster formation using TIRF microscope. Scale bar = 10 μm.
- Time‐lapse imaging of the MT aster formation using TIRF. Scale bar = 10 μm.
- Magnified images of (B). Time interval 30 s. Time bar indicates (min:sec). MTs showing dynamic instability were indicated with asterisks. Scale bar = 5 μm.
- Number of MTs emanating from the aMTOCs in microwells. Tubulin 18 μM. n = 20 wells. Violin plots were shown with the median (horizontal line).
