
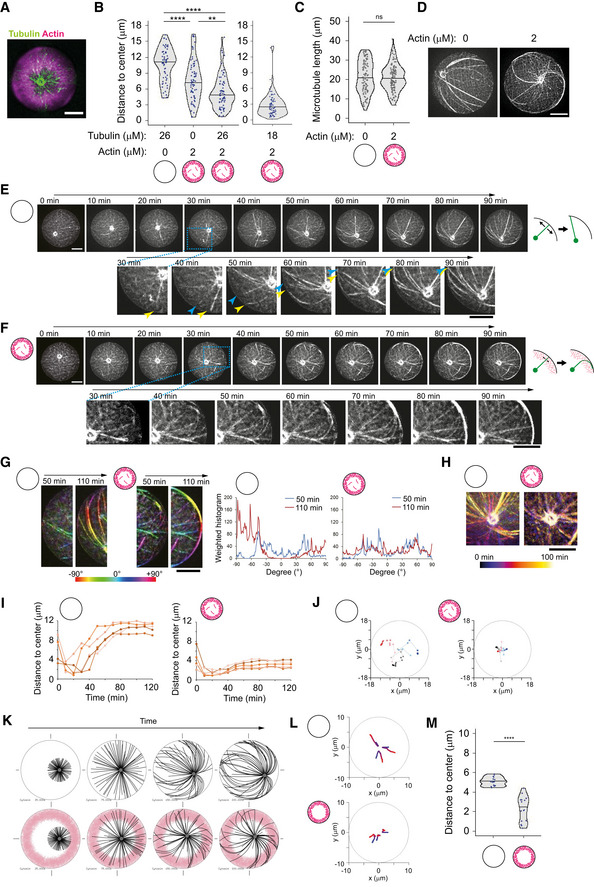
Figure 4. Cortical branched actin meshwork favors aster centering.
-
ARepresentative image of MT aster with cortical actin. Partial maximum projection was shown. Tubulin 26 μM, actin 2 μM, and Arp2/3 complex were added into NPF (WA)‐coated microwells.
-
BDistance from aMTOC to well center (2 h after sample preparation). Left: Tubulin 26 μM Actin 0 μM, n = 61, Tubulin 0 μM Actin 2 μM, n = 73, Tubulin 26 μM Actin 2 μM, n = 70 wells. Tubulin 18 μM Actin 2 μM, n = 76 wells. **P < 0.01, ****P < 0.0001, ns (not significant) > 0.1 (Kruskal–Wallis test with Dunn's multiple comparison test).
-
CMeasurement of MT length in the absence or presence of cortical actin. Tubulin 26 μM. Images were taken 2 h after sample preparation. Actin 0 μM, n = 96, 2 μM cortex n = 104 MTs (from 6 wells, respectively). ns (not significant) > 0.1 (Mann–Whitney U test).
-
DRepresentative images of MT organization in the absence or presence of cortical actin. Tubulin 26 μM.
-
E, FTime‐lapse imaging of MT aster positioning at 26 μM in the absence (E) or presence (F) of cortical actin. Final actin structure was shown in (A). Magnified images were also shown. In magnified images in (E), the blue and yellow arrowheads indicate the MTs slipping along the well edge, respectively. Right schemes indicate how MTs behave along cell boundary. In the absence of actin, MTs slipped and reoriented along well boundary as they grew. In contrast, MT reorientation was restricted in the presence of actin, although MTs can grow through actin network and along well boundary.
-
GOrientation of MTs near the well edge in the absence or presence of cortical actin. Orientation of MTs was shown with different colors. Right graph indicates the measurement of the MT orientation using Orientation J. The different time points were shown with different colors. Another example is also shown in Fig EV4D. In the absence of cortical actin, the MT orientation dynamically changed over time, whereas in the presence of cortical actin, the MT orientation was not significantly changes.
-
HMT motion around the aMTOC shown in (E) and (F). Temporal‐color coded images were shown. The position of aMTOC was centered at each time point in the image.
-
IaMTOC position over time in the absence (left) or presence (right) of cortical actin. Five representative data per condition were shown.
-
JRepresentative trajectories of aMTOCs in microwells from light colors (0 min) to dark colors (120 min). Time‐lapse imaging was performed for 2 h at 10‐min intervals. Three trajectories per condition were shown with different colors.
-
KSimulations in the absence or presence of actin. Different time points (From left, 25, 75, 150, and 200 s) were shown. MTOC—gray, MT—black, actin—pink.
-
LRepresentative trajectories of MTOC from blue (0 s) to red (200 s). The initial position (0 s) was randomly chosen within 4 μm from the cell center. Three simulations per condition.
-
MFinal position of MTOC (at 200 s). Fifteen simulations per condition. ****P < 0.0001 (Mann–Whitney U test).
Data information: Violin plots were shown with the median (horizontal line). Scale bar = 10 μm in (A) and (D)–(H).