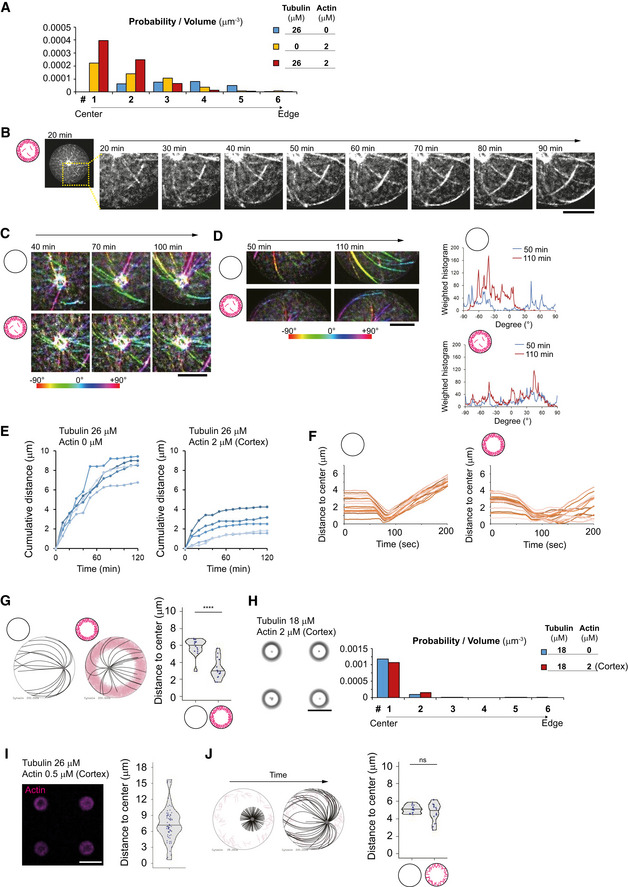
Figure EV4. Characterization of aMTOC positioning and MT behaviors in the absence or presence of cortical actin network.

- Time‐lapse imaging of MT aster positioning at 26 μM of tubulin in the presence of cortical actin shown in Fig 4F. Magnified images were shown. Scale bar = 10 μm.
- Orientation of MTs around the MTOCs in the absence or presence of cortical actin. The samples were same as shown in Fig 4E and F. Orientation of MTs was shown with different colors. Scale bar = 10 μm.
- Other representatives showing orientation of MTs near the well edge in the absence or presence of cortical actin. Orientation of MTs was shown with different colors. Right graph indicates the measurement of the MT orientation using Orientation J. The different time points were shown with different colors. Scale bar = 10 μm.
- The path length (cumulative distance) of the aMTOC during the time‐lapse imaging was measured for the indicated conditions. The data of individual aMTOC were shown with different colors (10 aMTOCs per condition). Images were taken at 10‐min intervals.
- Simulations of MTOC position over time in the absence (left) or presence (right) of cortical actin. Fifteen simulations per condition were shown with different colors.
- Simulations in the presence of smaller number of MTs. The images represent the time point at 200 s. Right graph shows the final position of MTOC (at 200 s). ****P < 0.0001 (Mann–Whitney U test). Fifteen simulations per condition.
- aMTOC position in the presence of 26 μM tubulin and with less dense cortical actin assembled at a lower concentration of actin (0.5 μM). Right panel shows measurement of distance from aMTOC to center of the well (2 h after sample preparation). n = 71 wells. Scale bar = 50 μm.
- Simulations in the presence of lower density of cortical actin. The time points at 200 s were shown. Right graph shows the final position of MTOC (at 200 s). Data of the absence of actin (left) are same as shown in Fig 4M. ns (not significant) > 0.1 (Mann–Whitney U test). Fifteen simulations per condition.
Data information: Violin plots were shown with the median (horizontal line).
