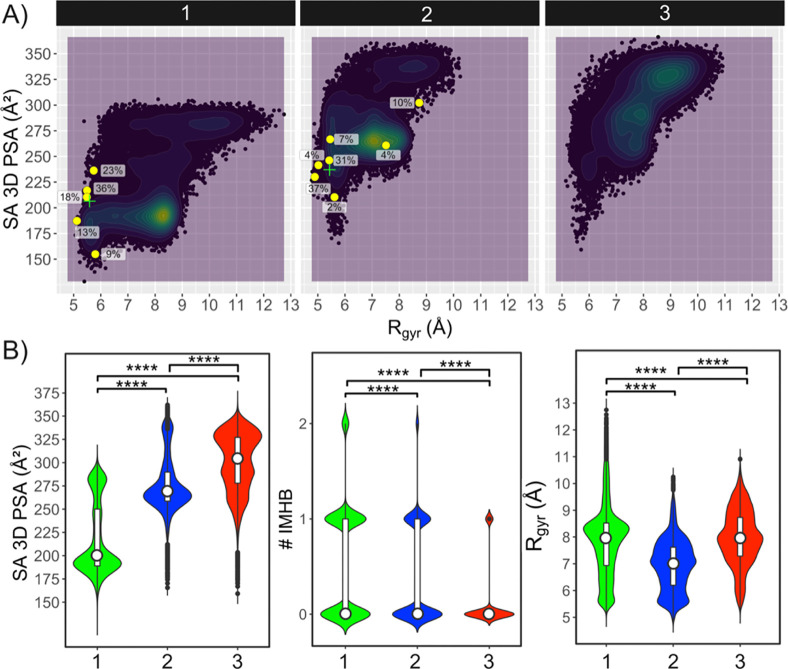
Figure 4.
Descriptors calculated from the MD simulations for the S,S-stereoisomers of PROTACs 1–3 in explicit chloroform. (A) Chemical property space populated by 1–3 as revealed by plotting of the SA 3D PSA vs the Rgyr of the conformations from the MD simulations. Densely populated property space is colored green to yellow. The conformations determined by NAMFIS for S,S-1 and S,S-2 are shown as yellow circles, and their population in % is given adjacent to each circle. The green cross signs indicate the population-weighted mean values of the SA 3D PSA and Rgyr in the ensembles determined by NAMFIS for S,S-1 and S,S-2. (B) Distribution of the SA 3D PSA (left), the number of IMHBs (# IMHB, center), Rgyr (right) of the conformations from MD simulations. White bars and circles indicate the 25th to 75th percentiles and the mean values, respectively. Wilcoxon test p-values: **** ≤ 0.0001.

