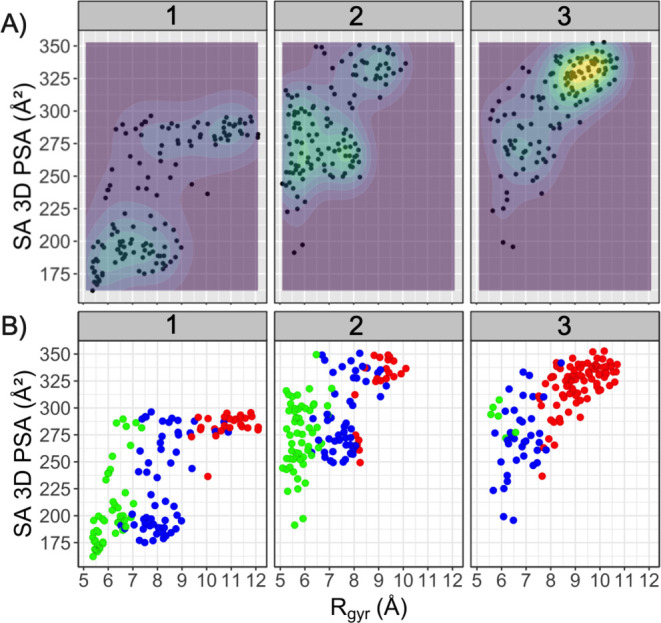
Figure 7.

(A) Overview of the distribution of the diverse subset of 26 conformations in the five structural clusters of each PROTAC in chemical property space defined by the Rgyr and SA 3D PSAs. Regions of property space that display greater structural diversity, that is, which are more densely populated by the selected conformations, are indicated by green-yellow color and by the contour lines. (B) Distribution of conformations with different folds in the chemical property space. Folded conformations are in green, semi-folded in blue, and linear conformations are in red, just as in Figure 6. Note that some conformations populate identical property space and are therefore superimposed in panels A and B.
