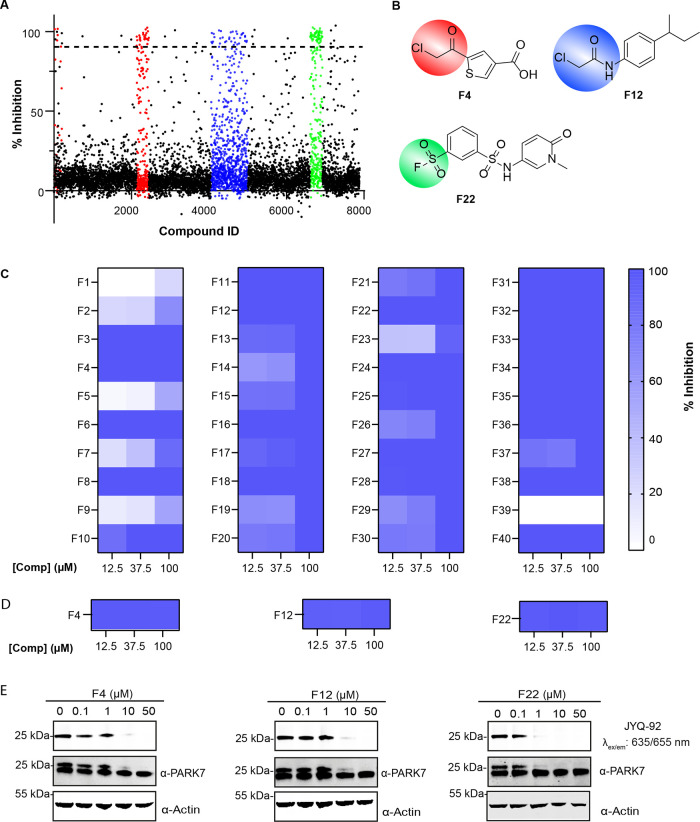
Figure 6.
High-throughput PARK7 inhibitor screen on a covalent fragment library using the FP assay. (A) Screening results at 100 μM compound concentration. Colors represent three different compound groups with the highest hit rate. (B) Structures of representative hits. Colors correspond to those in Figure A. (C) Heatmap displaying the validation of the screening hits at 12.5, 37.5, and 100 μM using the FP assay. (D) Heatmap displaying the validation of the representative hits at 12.5, 37.5, and 100 μM using the DiFMUAc assay. (E) Validation of representative hits in a cell lysate. The prepared cell lysate was incubated with a dilution series of each compound, followed by incubation with JYQ-92 (1 μM).

