
Figure 3.
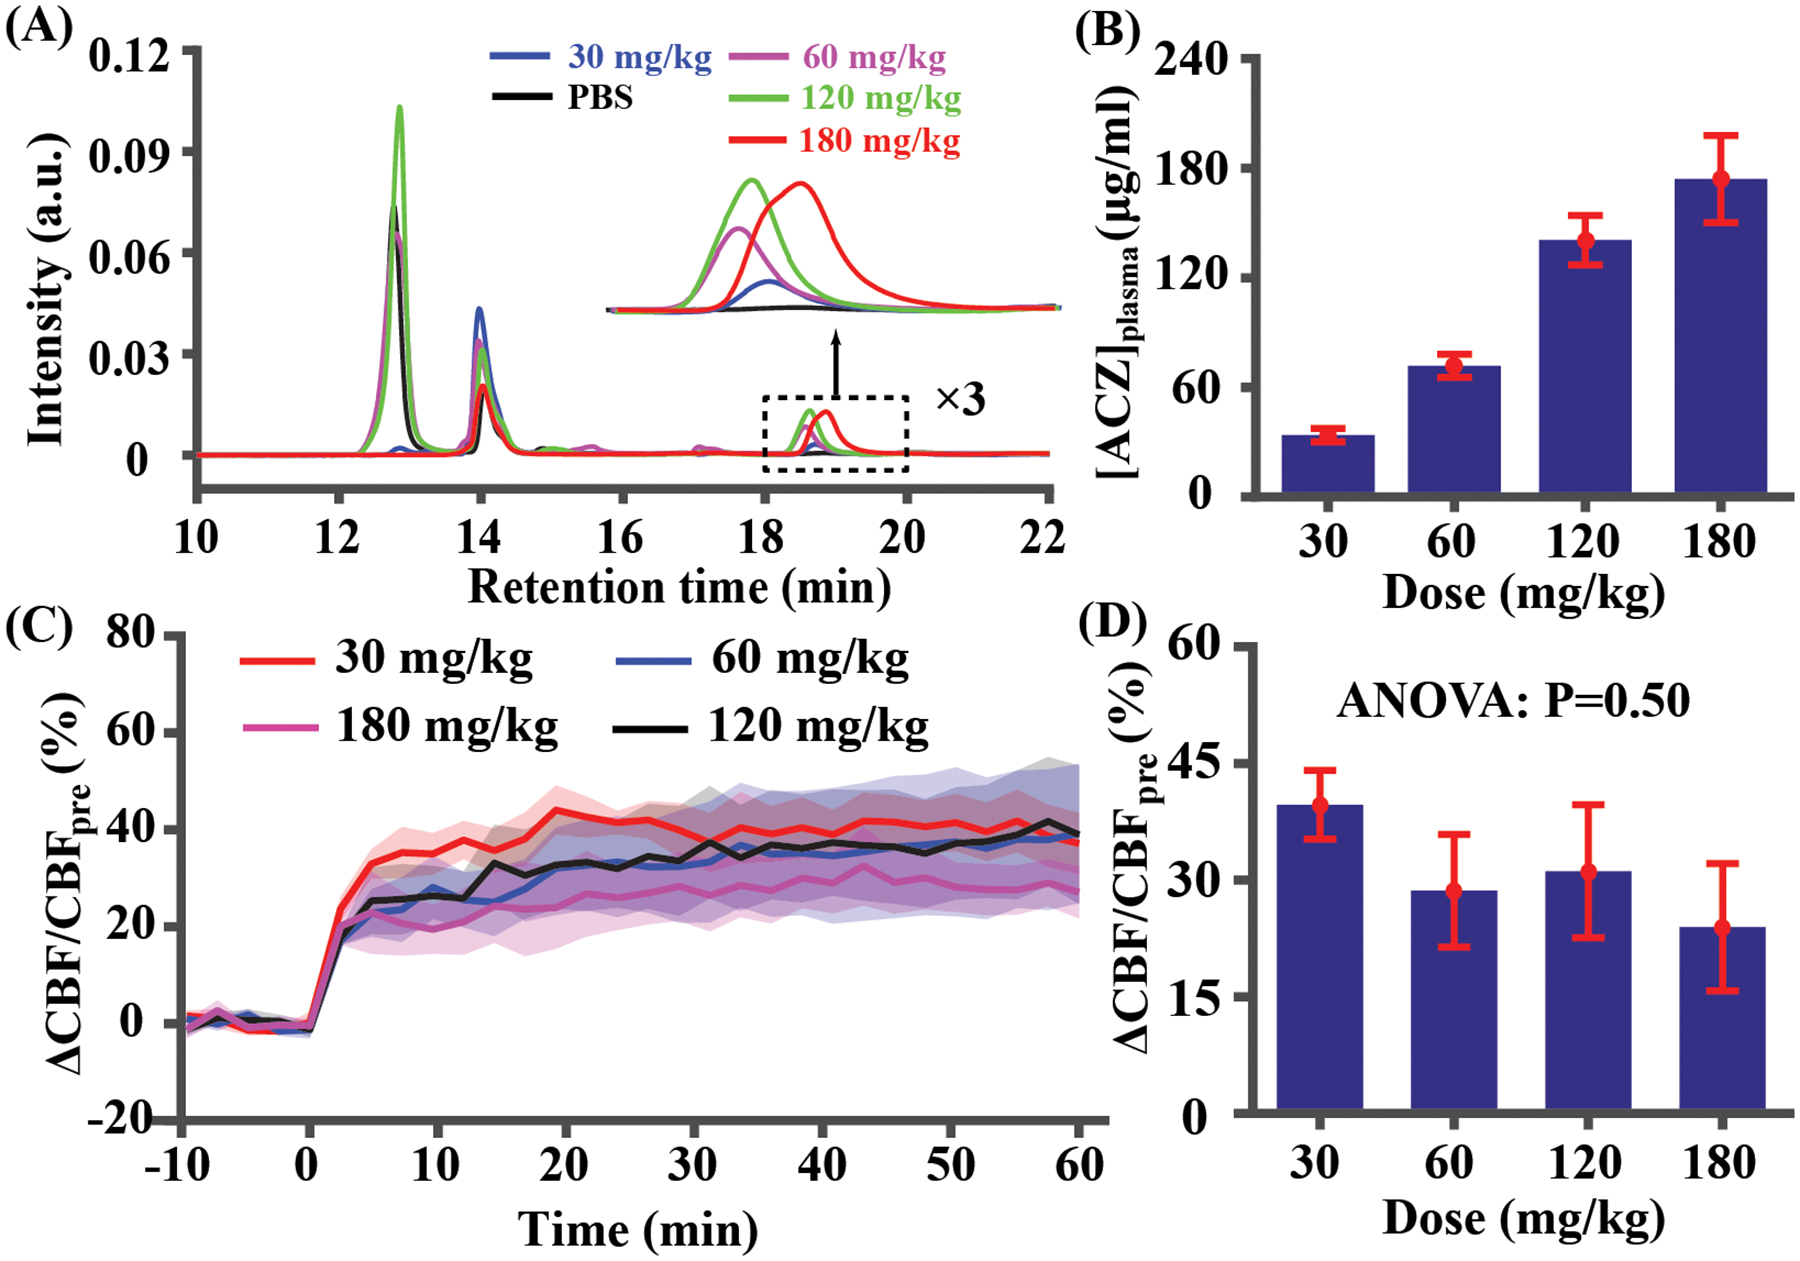
[ACZ]plasma and vascular responses of different doses (30, 60, 120, and 180 mg/kg) (N=5). (A) HPLC chromatograms in a representative mouse. (B) Quantitative concentration values at different doses. (C) Time-courses of vascular responses at different doses. Time 0 indicates the start of injection. (D) Quantitative CBF changes based on the average of data during 10–20 minutes post-injection. Error bar denotes the standard error across mice.