
Figure 3:
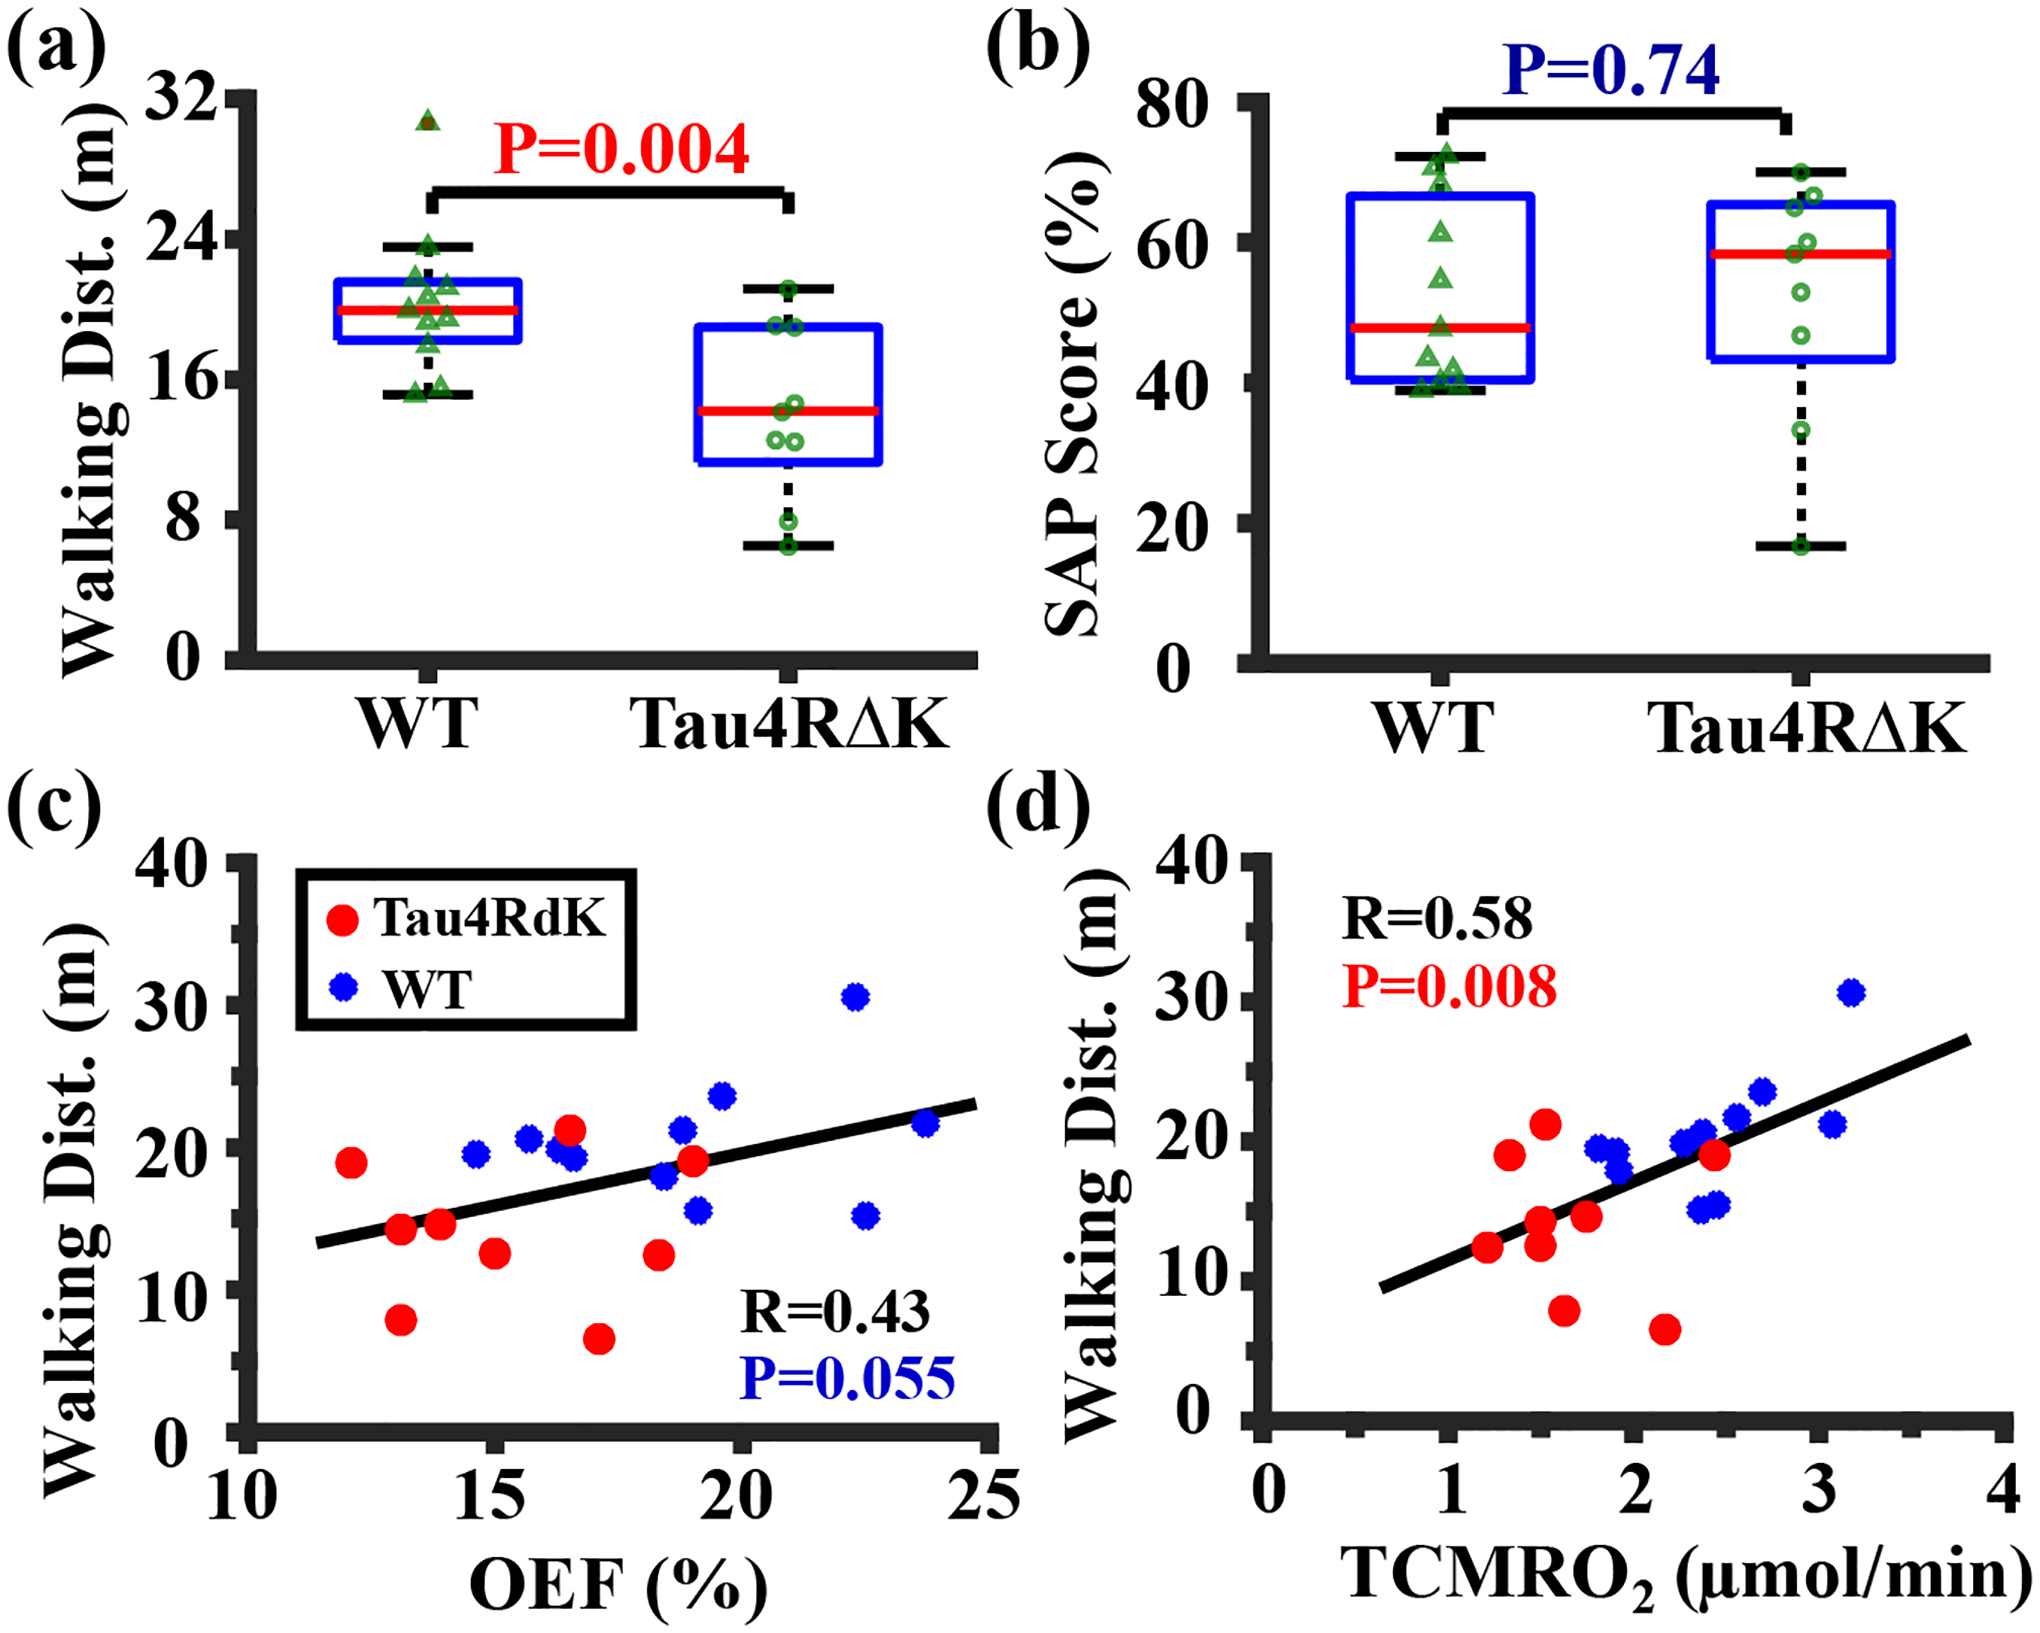
Behavioral performance and its correlation with oxygen metabolism in the Tau4RΔK study. (a) Walking distance and (b) SAP score in Tau4RΔK (N=9) and WT (N=11) mice shown with box plots. (c) Correlation between walking distance and OEF. (d) Correlation between walking distance and TCMRO2. Red and blue dots represented Tau4RΔK and WT mice, respectively.