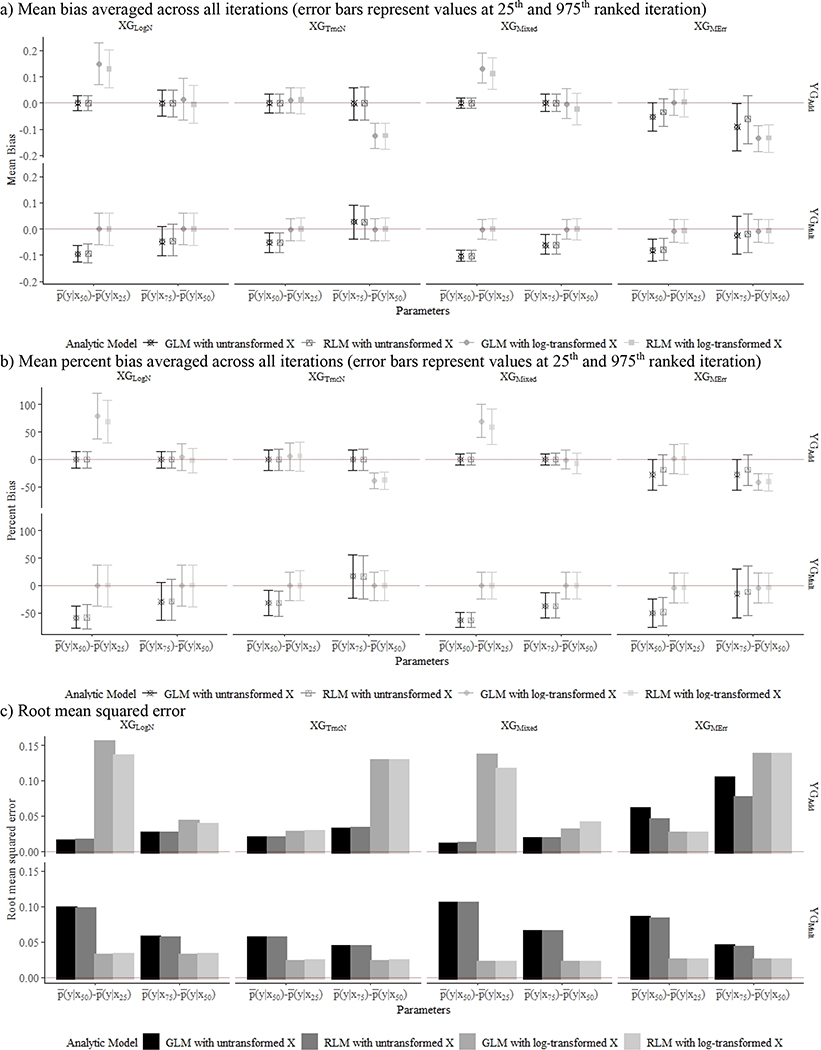
Figure 1.
Mean bias (a), percent bias (b), and root mean squared error (c) associated with . Each figure contains results from 8 X generation method (XGs) and Y data generation methods (YGs) across 1000 simulations with a sample size of 500, with additive YG presented in the top row and multiplicative YG in the bottom row.
aXGLogN: ln(X) ~ N(μ=0.42, σ=0.8); bXGTruncN: X ~ TN (a=0.01, μ=0.42, σ=2.4); cXGMixed: 80% of X ~ TN (a=0.01, μ=0.42, σ=2.4), 20% of X ~ TN (a=0.01, μ=0.63, σ=7.2); dXGMErr; 95% of X ~ XTruth, 5% of X ~ XTruth*MErr, where XTruth ~TN(a=0.01, μ=0.42, σ=2.4) and MErr ~ TN(a=0.01, μ=1, σ=2).; eYGAdd; Y = 0.3X + N(0,1).; fYGMult: Y = 0.3ln(X) + N(0,1).

