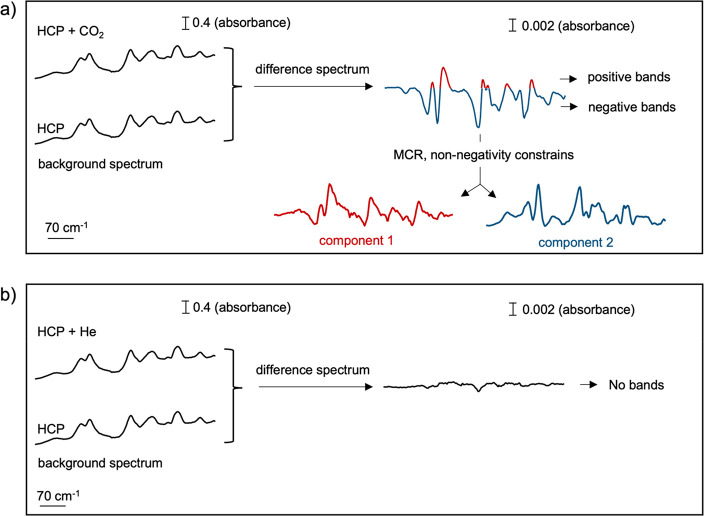
Figure 2.
Representation of the spectral components obtained upon processing the difference spectrum using multivariate curve resolution (MCR). (a) The represented difference spectrum corresponds to the average of the difference spectra acquired under a CO2 atmosphere at 50 °C. (b) The represented difference spectrum corresponds to the average of the difference spectra acquired under a He atmosphere at 50 °C.

