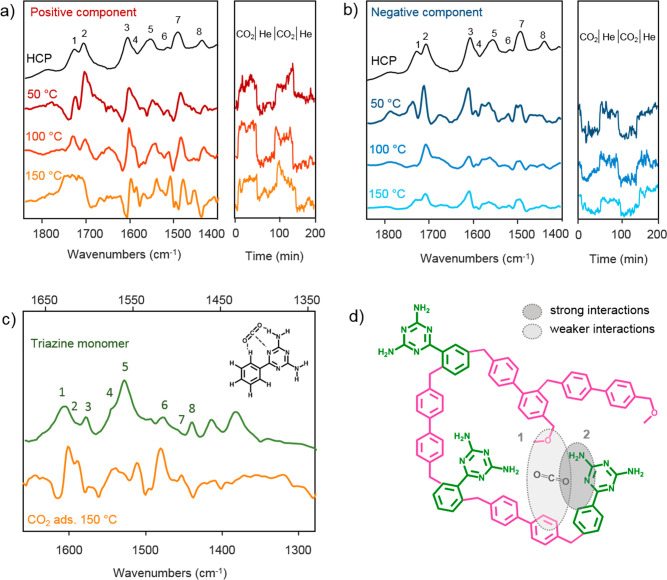
Figure 3.
DRIFTS study of CO2 adsorption on HCP. Left panels of (a) and (b): comparison between the DRIFT infrared spectrum of the triazine–biphenyl HCP sample with the positive (a) and negative (b) spectral components obtained for CO2 adsorption measurements at 50, 100, and 150 °C after performing MCR analysis. The right panels of (a) and (b) represent the component concentration profiles obtained by MCR. (c) Comparison between the ATR infrared spectrum of the triazine monomer with the positive spectral components obtained for CO2 adsorption measurements at 150 °C after MCR analysis. (d) Illustration of the CO2 adsorption sites in triazine–biphenyl HCP.

