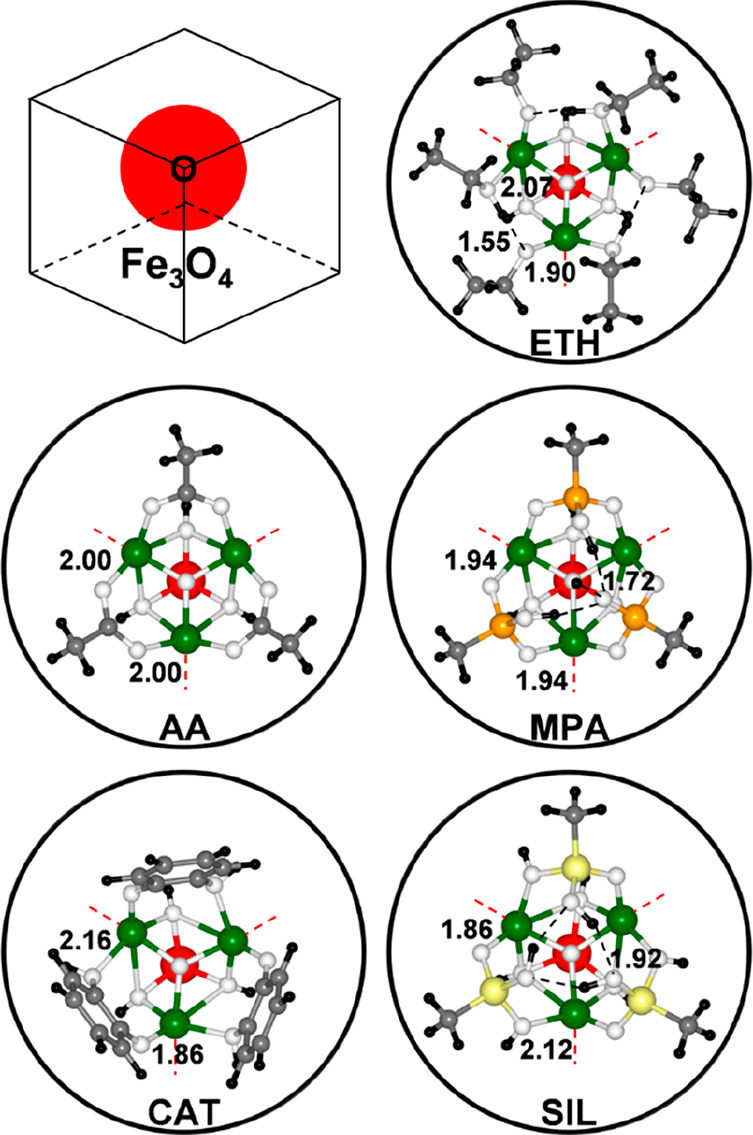
Figure 2.

Ball-and-stick representations for the adsorption of different ligands at local high coverage onto the NP corner. Only the ligands and the NP O-corner are shown for clarity, as schematized in the top left corner of the figure. The red dashed lines indicate the edges of the hidden NP. The black dashed lines indicate the formation of hydrogen bonds. The H-bond and the Fe–OLigand bond lengths (in Å) for the asymmetric unit are shown. The black, gray, orange, yellow, white, green, and red beads represent H, C, P, Si, O, Fe, and FeOct on which the spin-flip process is investigated, respectively.
