Fig. 4.
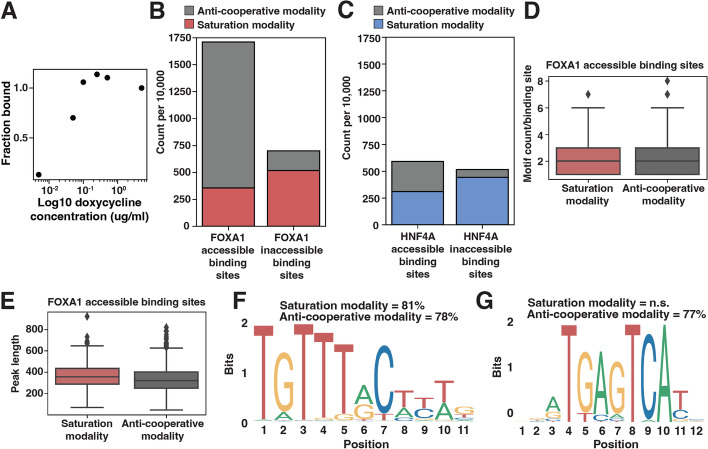
Characterization of anti-cooperative binding behavior. A Example binding curve at a single genomic site that exhibits anti-cooperative behavior. B, C A sample of 10,000 FOXA1 (B) or HNF4A (C) accessible (left bar) or inaccessible (right bar) binding sites colored by if they display saturation binding behavior (red or blue) or anti-cooperative binding behavior (gray). D FOXA1 motif count between the accessible binding sites from B that display either saturation or anti-cooperative binding behavior. Motifs were called from FIMO with a p-value threshold of 1e−3. E Binding peak length between the accessible binding sites from B that display either saturation or anti-cooperative binding behavior. F The most enriched motif discovered in FOXA1-accessible saturation and anti-cooperative peaks was FOXA1 (JASPAR MA0148.1). It is significantly enriched for both the saturation behavior (p = 2.19e−001) and anti-cooperative behavior (p = 1.23e−01). G The second most enriched motif discovered in FOXA1-accessible anti-cooperative peaks was AP1 (JASPAR MA1141.1). It was not discovered in the saturation behavior peaks. It is significantly enriched for only the anti-cooperative behavior (p = 1e−008)

