Fig. 1.
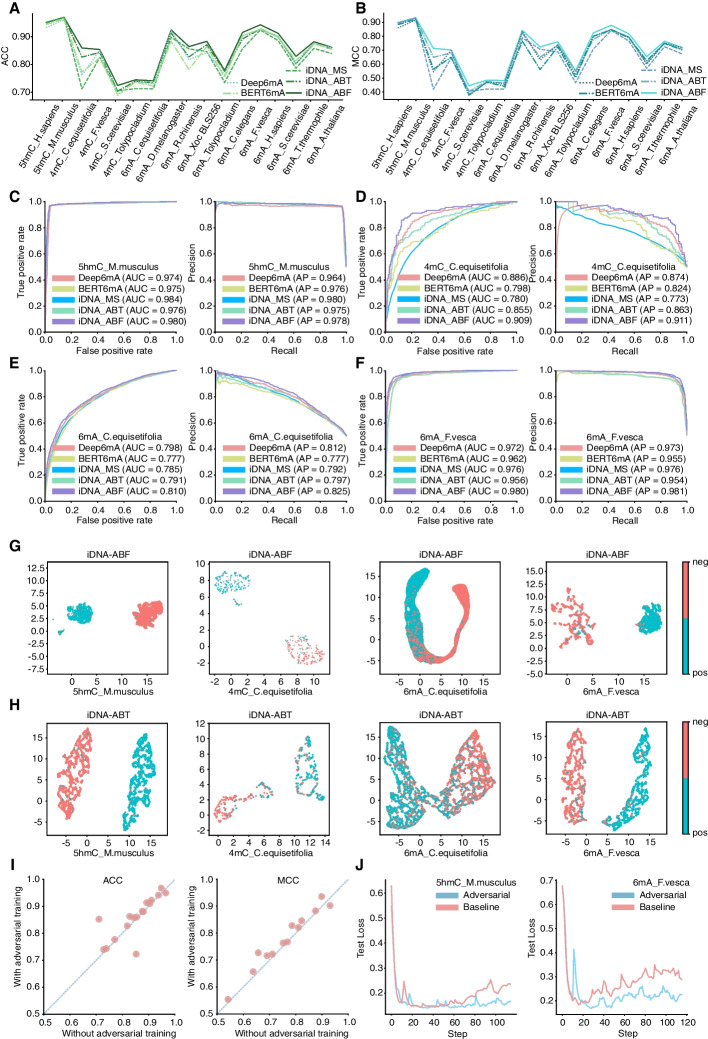
Performance comparison between iDNA-ABF and other existing methods. A and B represent the ACC and MCC values of our proposed iDNA-ABF and other existing methods including iDNA-ABT, iDNA-MS, BERT6mA, and Deep6mA on 17 benchmark independent datasets, respectively. C The ROC and PR curves of our proposed iDNA-ABF and other existing methods in 5hmC_M.musculus. D The ROC and PR curves of our proposed method and other existing methods in 4mC_C.equisetifolia. E The ROC and PR curves of our proposed iDNA-ABF and other existing methods in 6mA_C.equisetifolia. F The ROC and PR curves of our iDNA-ABF and other existing methods in 6mA_F.vesca. G and H represent the feature space distribution (with UMAP visualization) of iDNA-ABF and iDNA-ABT in 5hmC_M.musculus, 4mC_C.equisetifolia, 6mA_C.equisetifolia, and 6mA_F.vesca, respectively. Negative (in red color) and positive (in blue color) represent non-methylation and true methylation samples, respectively. I The MCCs and ACCs of the models with and without adversarial training on 17 benchmark independent datasets, respectively; each point in the figure represents each dataset. J Learning curves of the model with and without the use of adversarial training on 5hmC_M.musculus, and 6mA_F.vesca

