Fig. 1.
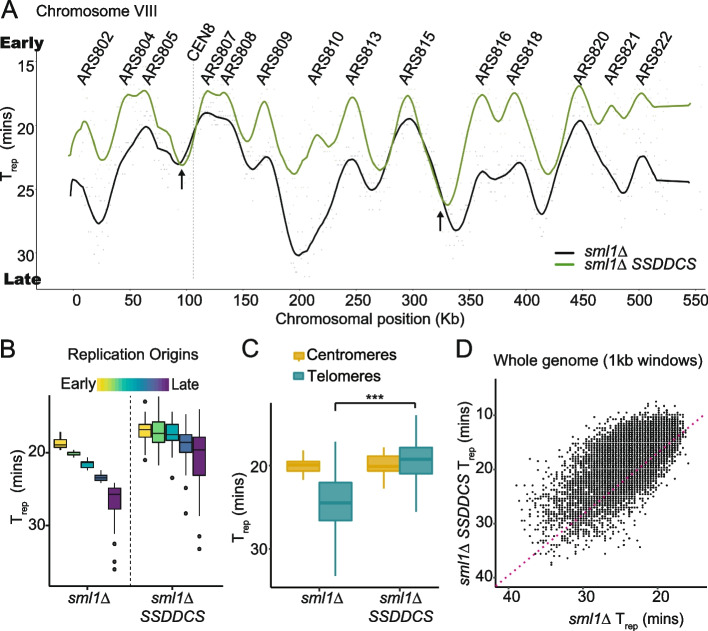
Over-expression of limiting initiation factors causes global early replication. A Trep values were plotted from the indicated strains along the corresponding chromosome positions to generate genome-wide replication profiles and smoothed using a moving average. Chromosome VIII is shown here as an example. The y-axis is flipped so that early replicating regions are at the top of the plot and late-replicating regions at the bottom. The location of annotated origins (ARS) is shown above. Overall, all origins fire earlier in the SSDDCS strain. Arrows indicate termination zones that have a delayed Trep in the SSDDCS strain. B Distribution of Trep values for all origins divided into quintiles according to Trep values from the sml1Δ strain. C Box and whisker plot of the Trep values for all centromeres and telomeres (within 50kb of chromosome ends).*** p-value = < 2.2e−16, Welch two-sample t-test. Centromeres were not significantly affected by SSDDCS over-expression (p-value = 0.9578, Welch two-sample t-test). D Scatterplot of the Trep values for the whole genome in 1-kb bins. Red dashed line is the line of equal Trep between the sml1Δ and sml1Δ SSDDCS strains

