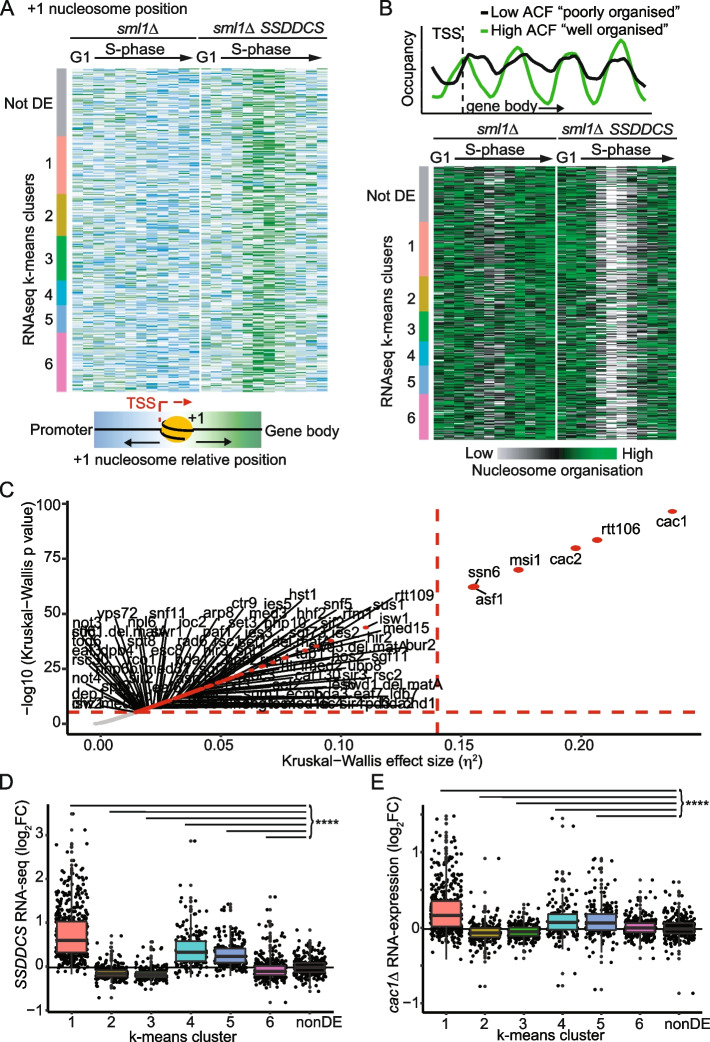
Fig. 5.
Global early replication perturbs chromatin conformation in a single cell cycle. A Position of the +1 nucleosome relative to the transcriptional start site (TSS) represented as a heatmap for the DE genes separated into their k-means cluster (Fig. 2C) plus 250 random non-DE genes with an annotated +1 nucleosome. Blue represents the most upstream position of the +1 nucleosome, while green represents the most downstream position (into the gene body). Data is normalized by row as done for previous heatmaps. Each row corresponds to a single gene and each column to a single timepoint (G1 to 60 from left to right, respectively). B Top: The nucleosome occupancy and organization of the first 4 nucleosomes after the TSS was analyzed using an autocorrelation function (ACF) analysis: nucleosomes in green are well phased (i.e., well defined peak and valleys) and well positioned (similar inter-nucleosome distance), corresponding to high ACF values. On the other hand, nucleosomes in black are poorly phased and disorganized, resulting in low ACF. Bottom: Heatmap of ACF values for the DE genes and 350 random non-DE genes longer than 700bp. Each row corresponds to a single gene and each column to a single timepoint (G1 to 60 from left to right, respectively). The two strains are separated by a white vertical line. White and green represents the timepoints at which the chromatin is mostly disorganized and organized, respectively. C Plot of statistical significance versus effect size for Kruskal-Wallis tests applied to chromatin mutant gene expression data from [38]. Red dashed horizontal and vertical lines represent a Bonferroni-corrected p-value threshold of 0.001 and a high-effect threshold (η2 = 0.14), respectively. D Box and whisker plot of the averaged gene expression change in the SSDDCS strain for the k-means clusters from the RNA-seq data in Fig. 2C. p-values are from Holm-corrected Wilcoxon rank sum tests relative to 300 random non-DE genes (black). **** p < 0.0001. E Box and whisker plot of the RNA expression changes in the cac1∆ strain (data from [38]). p-values are from Holm-corrected Wilcoxon rank sum tests relative to 300 random non-DE genes (black). **** p < 0.0001

