Fig. 2.
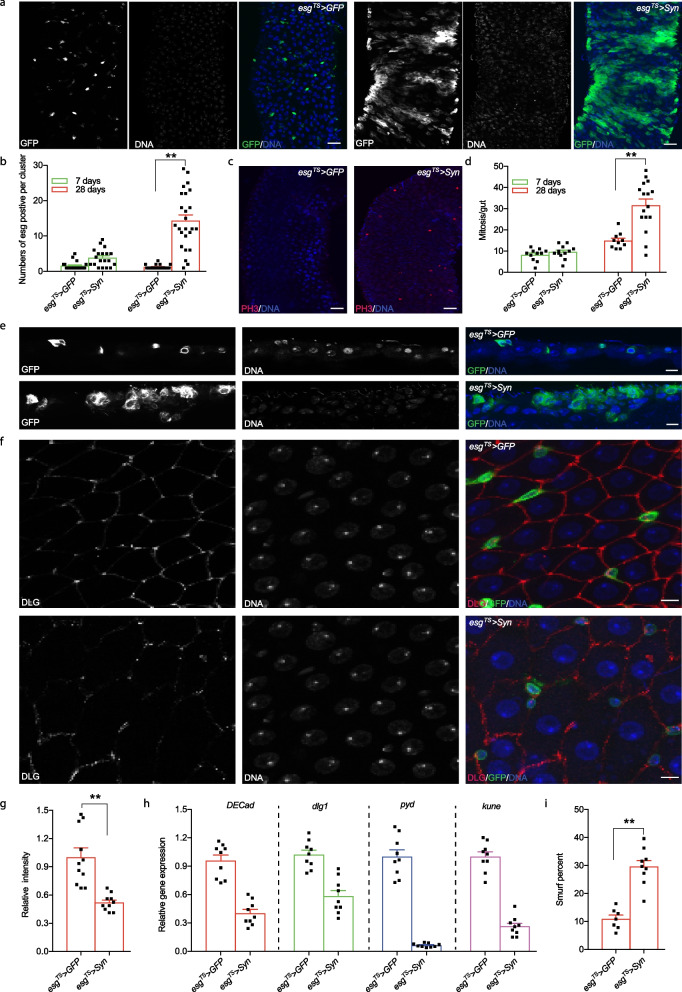
Intestinal overexpression of α-syn causes dysplasia in the Drosophila intestine. a Representative images of the anterior midguts of esgTS > GFP and esgTS > Syn flies after 28 days at 29 °C. Intestinal stem cells (ISCs) and enteroblasts (EBs) were labelled by GFP expression (green), and DNA was detected using DAPI staining (blue). b Quantification of cells in esg-positive cell clusters in the anterior midgut. Scale bars: 100 μm. c, d Increased cell proliferation per adult midgut in flies expressing α-syn. Representative images of gut expressing α-syn and GFP. Red, Phospho-histone H3; blue: DNA; Scale bars, 100 μm. e The disorganized architecture of the intestinal epithelium. Cross-sections of intestines illustrate the loss of the monolayered structure of the intestinal epithelium in esgTS > Syn flies. ISCs and EBs were GFP-positive (green), and DNA was detected using DAPI (blue). Scale bars, 1 μm. f, g Representative images (f) and quantification (g) of anti-Dlg staining of the posterior midgut. The intercellular junction was unpaired. Green, GFP; Red, anti-Dlg; blue, DNA; scale bars, 1 μm. h Junction protein gene expression assayed by qPCR from middle intestines of esgTS > Syn and esgTS > GFP flies. DECad, Drosophila E-Cadherin; dlg1, disc large 1; pyd, polychaetoid; kune, kune-kune. i Intestinal overexpression of α-syn impairs the integrity of the Drosophila intestine. Smurf assay for intestine barrier defects was assessed in esgTS > Syn and esgTS > GFP flies on the blue dye-containing food. n is denoted as the number of spots on each column on the plot. Mean ± SEM; the P-values were calculated using one-way ANOVA with a Bonferroni multiple-comparison test. *P < 0.05; **P < 0.01; ***P < 0.001

