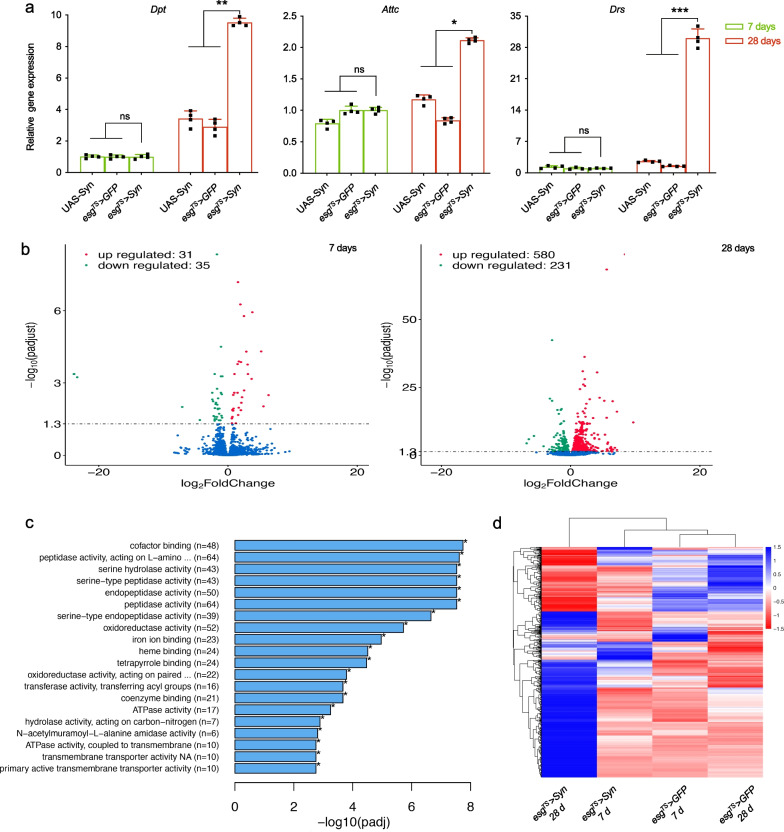
Fig. 3.
Intestinal overexpression of α-syn causes alterations of transcription profiles and microbiota composition. a Activation of intestinal immunity by intestinal α-syn. Antimicrobial peptide gene expression in the middle intestine of 28-day-old Drosophila using qPCR. Dpt, Diptericin; Attc, Attacin; Drs, Drosocin. n = 4. b Volcano plot comparing gene expression profiles of esgTS > Syn and esgTS > GFP in fly intestines. Red dots depict genes highly upregulated in esgTS > Syn intestines (log2 fold change < 1; adjusted P < 0.01), and green dots depict genes significantly downregulated in esgTS > Syn intestines (log2 fold change < 1; adjusted P < 0.01). Blue dots depict genes without significant alteration. c Gene ontology (GO) analysis of the significantly altered genes in esgTS > Syn intestines. The top 20 GO terms for the 2231 upregulated genes are shown in red. The heights of the columns represent the alteration level of gene expression in this GO term. d Supervised hierarchical clustering of genes based on RNA-Seq scores. The relative expression levels of clustered genes are shown on the right on a scale of -1.5 (downregulated) to 1.5 (upregulated)

