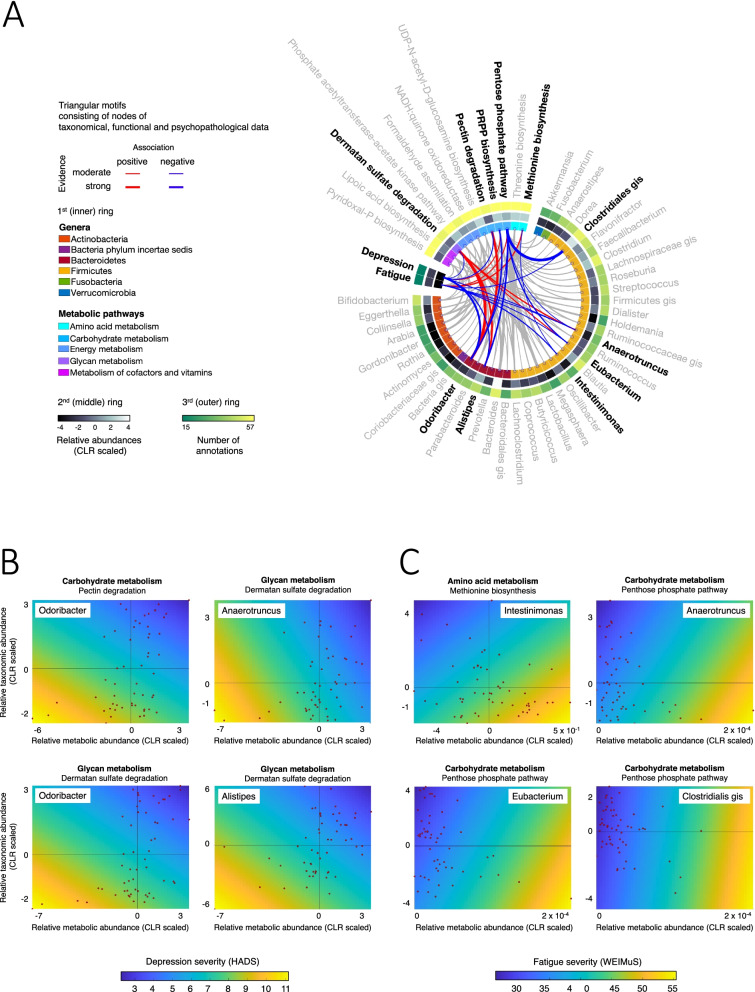
Fig. 4.
Results of motif analysis of correlation network topology. A Ring graph showing significant correlations of gut bacterial genera/metabolic modules with depression and fatigue severity. Triangular motifs associating both a bacterial taxon and a metabolic module with depression and fatigue are coloured (and taxa shown in boldface), and all other associations are displayed in grey. Those belonging to triangular motifs are displayed in red or blue (see colour key). Line thickness is proportional to association strength. On the inner ring, phyla and metabolic pathways are colour coded. On the second ring, relative abundances are coded as a grey-scale heatmap. On the outer ring, the number of patients in which the genus/metabolic module was found is colour coded from green to yellow. B Scatter plots showing taxonomic versus metabolic abundances for selected motif triplets (individual data points shown as red dots) with psychopathological severity values colour coded in the background (depression and fatigue severity increases from blue to yellow)

