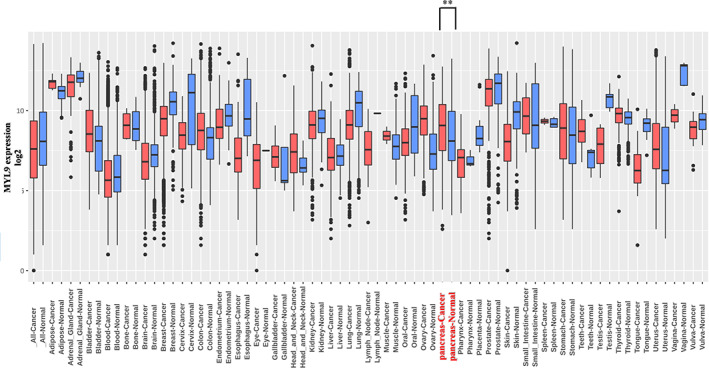
FIGURE 1.

MYL9 expression analysis of various tissue. GENT2 database was used for comparing myosin regulatory light polypeptide 9 (MYL9) expression levels in normal and tumor tissues. In pancreas tissue, MYL9 in pancreatic cancer tissue was upregulated relative to in normal pancreatic tissue (p < .01). Each bar represents the cut‐off level for significance (*p < .05, **p < .01)
