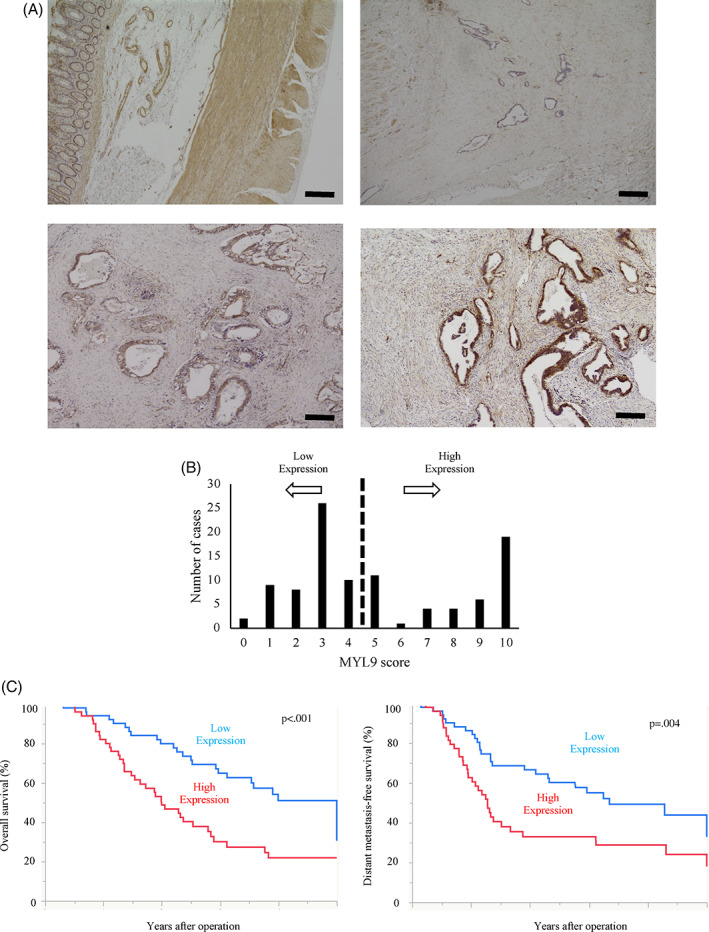
FIGURE 2.

The images are representative of each respective group. (A) Immunohistochemical staining of MYL9 based on intensity. The upper left panel demonstrates the smooth muscle tissue of the duodenum, and is the reference sample, assigned an intensity score of 2. Representative images for each intensity score are shown. For example, we assigned the negative, weakly positive, and strongly positive expression of MYL9 an intensity score of 0 (upper right panel), 1 (bottom left panel), and 2 (bottom right panel), respectively. (B) All patients were divided into MYL9 high and low groups by using the sum of the MYL9 score of five fields. (C) Correlation between MYL9 expression and overall survival and distant‐metastasis‐free survival. Kaplan–Meier curves demonstrated high MYL9 group was positively correlated to poorer prognosis (p < .001) and higher relapse rate (p = .004) than low MYL9 group
