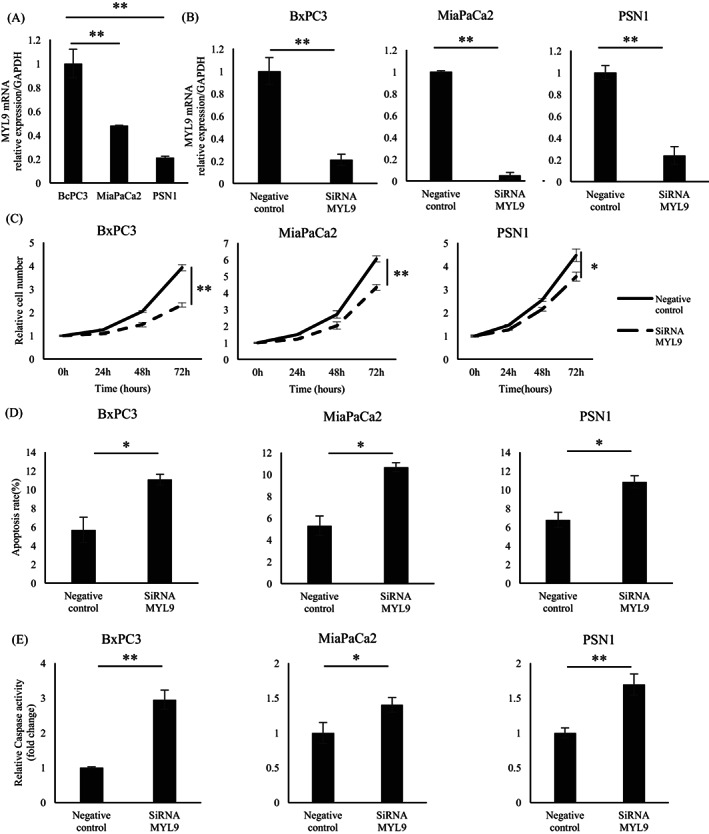
FIGURE 3.

Each bar represents the mean ± SEM values of samples measured in triplicate (*p < .05, **p < .01). (A) The mRNA expression levels of MYL9 in BxPC3 cell were higher than MiaPaCa2 and PSN1 cells. (B) The mRNA expression levels of MYL9 in BxPC3, MiaPaCa2, and PSN1 cells: siRNA‐MYL9 led to a significant reduction, compared with the negative control cell. (C) Proliferative activity of BxPC3, MiaPaCa2, and PSN1 cells: siRNA‐MYL9 significantly inhibited cell proliferation, compared with negative control cells. (D) The Annexin V and propidium iodide staining level of MYL9 in BxPC3, MiaPaCa2, and PSN1 cells: siRNA‐MYL9 led to apoptosis, compared with the negative control cell. (E) The caspase‐3/7 activity of MYL9 in BxPC3, MiaPaCa2, and PSN1 cells: siRNA‐MYL9 led to apoptosis, compared to the negative control cell
