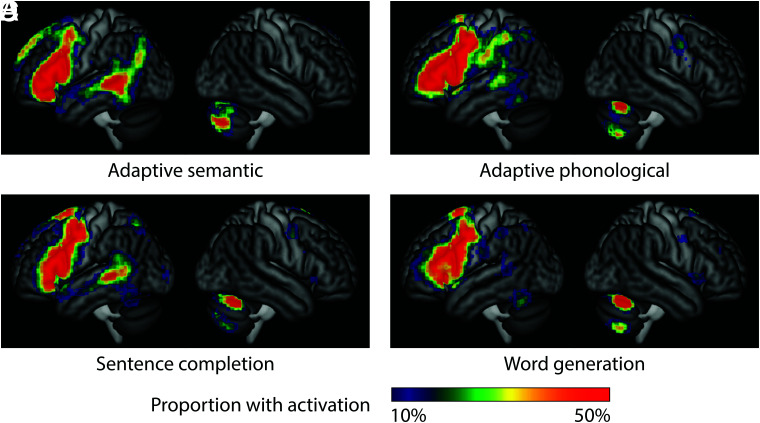
FIG 2.
Activation maps for each paradigm. The color map indicates the number of individual patients with activation, with a whole-brain ROI, relative threshold of 5%, and minimum cluster extent of 2 cm3. Activation maps for patients with right-hemisphere dominance were flipped for these maps. A, Adaptive semantic. B, Adaptive phonological. C, Sentence completion. D, Word generation.

