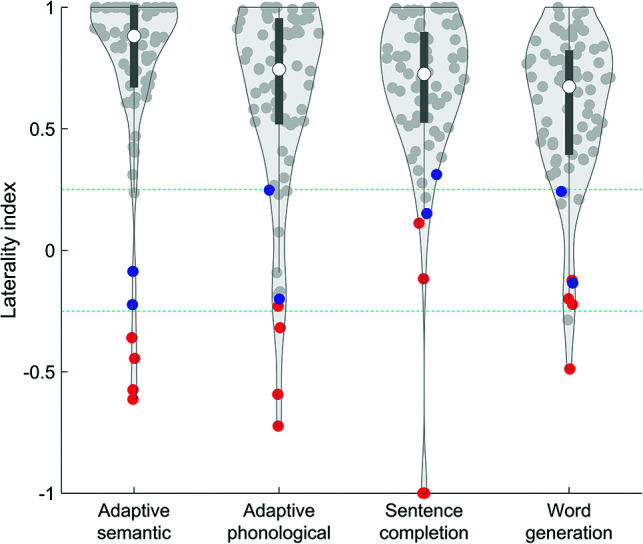
FIG 3.

Lateralization indices by paradigm. Violin plots show the distribution of patients. Red dots indicate patients with right-hemisphere language, and blue dots indicate patients with bilateral language lateralization. Teal dotted lines show cutoffs for lateralization categories.
