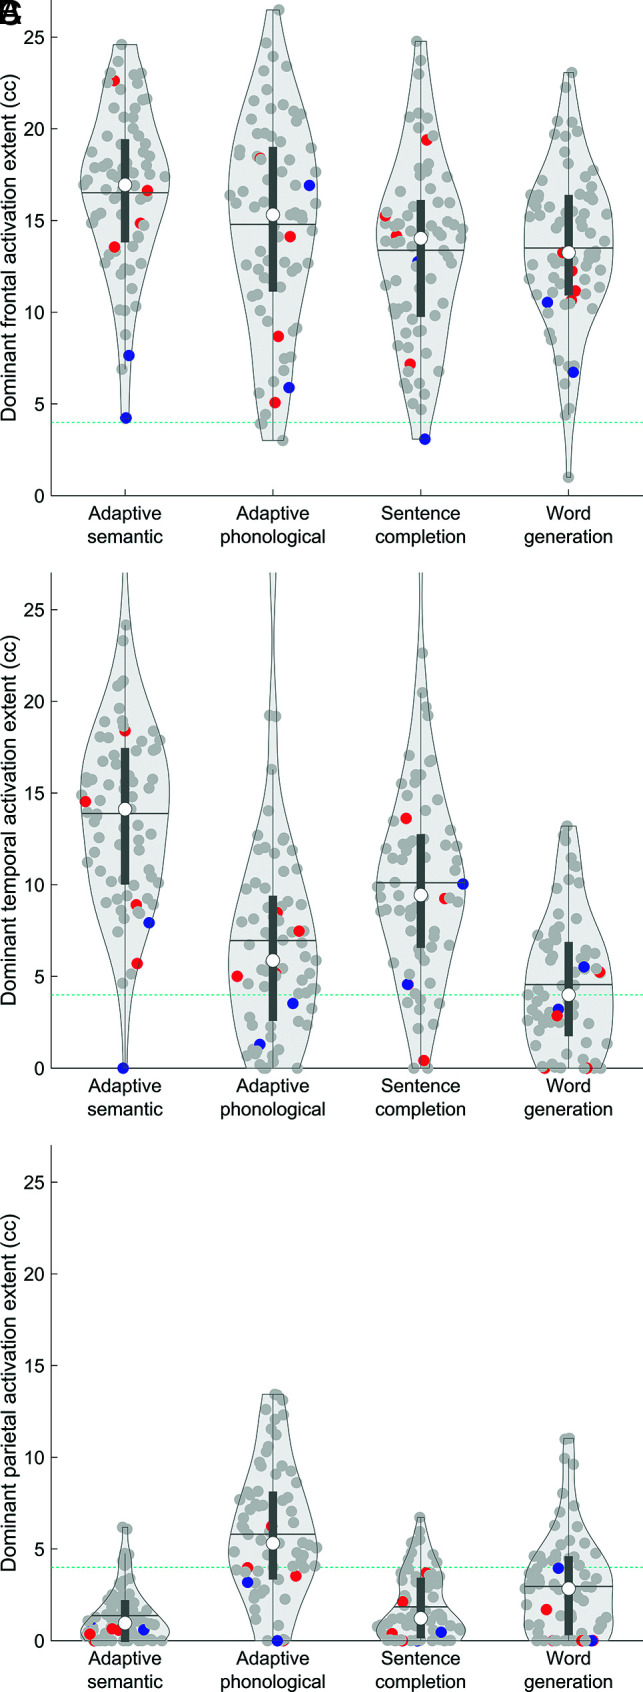
FIG 4.

Sensitivity for identifying language regions in the dominant hemisphere. Violin plots show the extent of activation in each region for each paradigm. Red dots indicate patients with right-hemisphere language, and blue dots indicate patients with bilateral language lateralization. Horizontal lines show means. Teal dotted lines show cutoffs for assessment of sensitivity. A, Inferior frontal language region. B, Posterior temporal language region. C, Anterior parietal language region.
