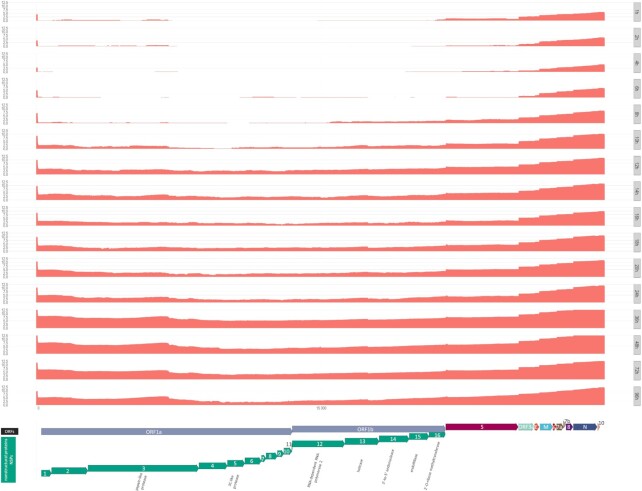
Figure 4:
Whole-genome coverage plot using high-quality (Q-score ≥8) reads from dcDNA samples that aligned to the SARS-CoV-2 genome used as a reference for this study. The coverages of the replicates from each hours post infection (hpi) group were summed, and the y-axes show the log2 of these values. Annotated protein-coding genes are shown at the bottom track. Direction of arrows depicts the coding strand.

