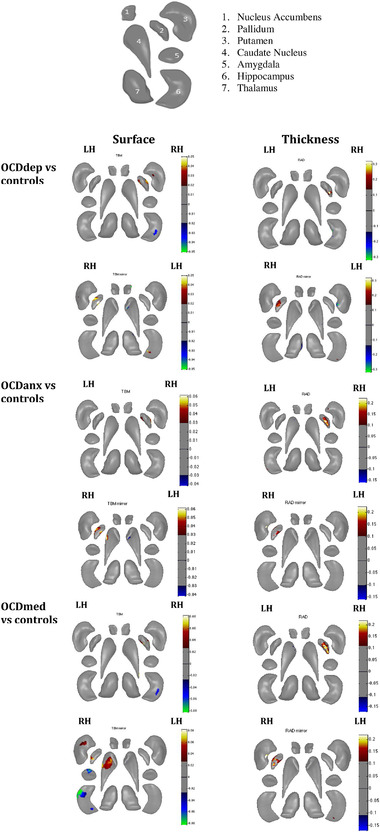
FIGURE 1.

Maps showing shape differences for all the subcortical structures between OCD cohorts and controls. The legend next to each figure shows the extent of the shape change (B‐value). Results are shown at p < 0.05, FDR corrected. The legend at the top is a label of the different subcortical regions for clarification. RAD: Shape thickness (Radial distance); TBM: Shape surface area (Jacobian determinant); LH: left hemisphere; RH: right hemisphere; OCDmed: OCD patients on medication; OCDdep: OCD patients with major depression; OCDanx: OCD patients with comorbid anxiety.
