
FIGURE 3.
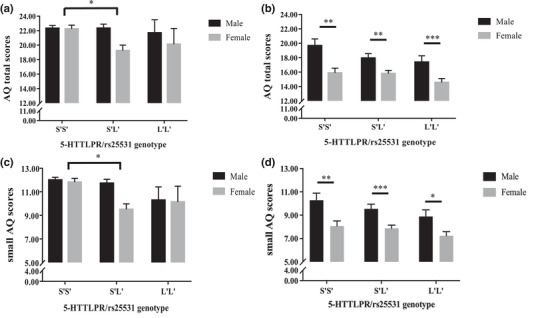
Mean scores of AQ total (top) and small AQ (down) for males and females in 5‐HTTLPR/rs25531 genotype groups presented separately in the Chinese and German samples (as derived by the ANCOVA (therefore the depicted results slightly differ from the information in Table 3). (a) and (c) for the Chinese sample, (b) and (d) for the German sample. Error bars show standard errors. * p < 0.05, ** p < 0.01, *** p < 0.001