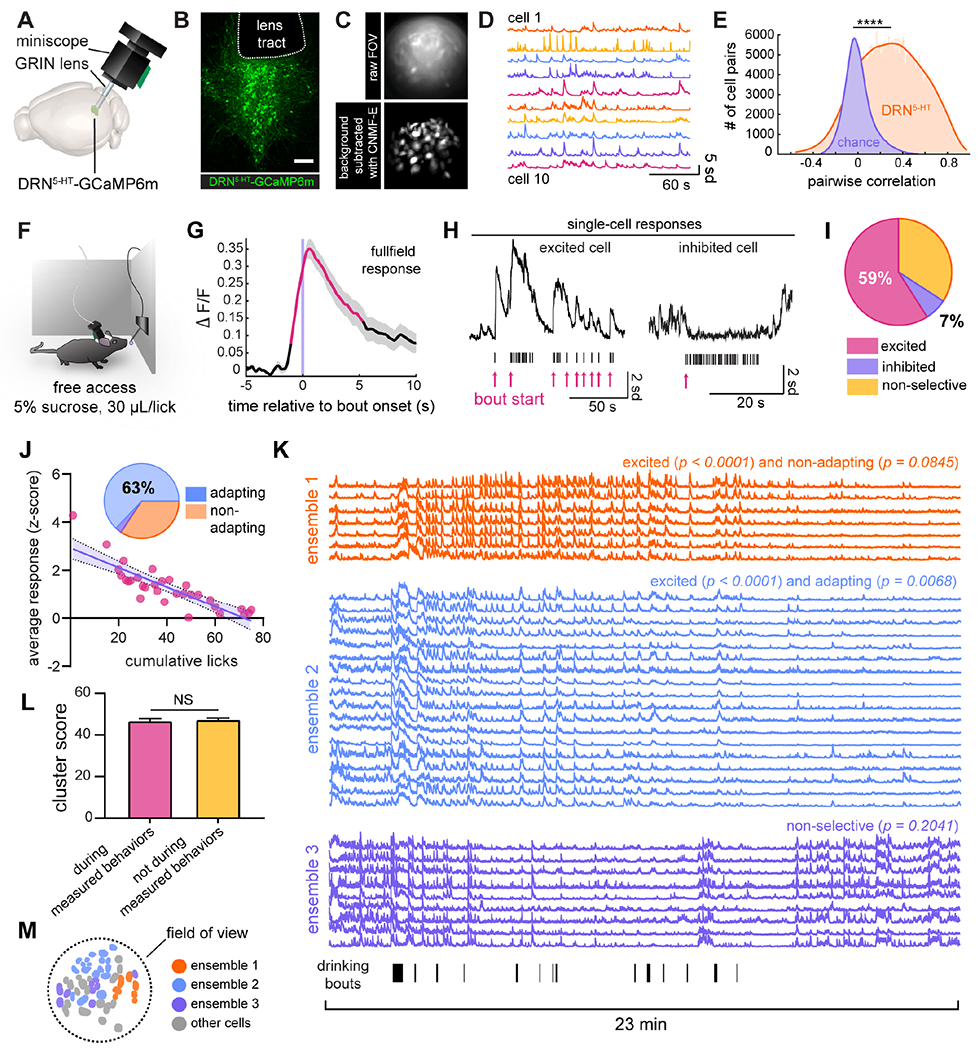
Figure 1. DRN5-HT neurons are recruited in correlated ensembles during sucrose consumption.

A) Summary of experimental setup: GCaMP6m is expressed in vivo in DRN5-HT neurons and imaged using an angled gradient refractive index (GRIN) lens and miniaturized microscope. Rendering adapted from the Allen Mouse Brain Atlas (Lein et al., 2007; Bakker et al., 2015). See also Fig. S1, Table S1, and Table S2.
B) Confocal image of the DRN, showing GCaMP6m-expressing DRN5-HT neurons and the bottom edge of the tract remaining after removal of the GRIN lens. Scale bar = 200 μm.
C) (top) Single frame from a representative imaging session. (bottom) Standard deviation projection of identified neurons from the same movie as above after background-subtraction with CNMF-E.
D) Example denoised activity traces from cells in (C). Units are standard deviation from each cell’s baseline fluorescence. See also Supplemental Video 1.
E) Distribution of pairwise Pearson’s correlation coefficients of DRN5-HT neuronal activity (n = 48,126 cell pairs) versus chance (n = 1,128 cell pairs x 1,000 simulations). K-S test, D statistic = 0.5543, p <<< 0.0001. See also Fig. S2.
F) Behavioral setup for sucrose consumption. A lick-triggered spout freely dispenses 30 μL drops of 5% sucrose water.
G) Average percent change in fluorescence of the entire field of view relative to drinking bout onset for a representative animal. Red line segments denote timepoints significantly different than baseline (permutation test, α < 0.05), gray shading represents ±SEM, and data is normalized to have a baseline of 0.
H) Responses of individual neurons to sucrose consumption. Shown are examples of raw activity traces. Tick-marks represent licks and red arrows indicate the onsets of separate drinking bouts.
I) Relative proportions of excited (183 cells, 59%), inhibited (21 cells, 7%), and non-selective cells (106 cells, 34%) found across all animals (n = 310 cells in 10 animals, shuffle test to determine significance, α = 0.05).
J) Of excited cells, the majority (63%, pie chart inset, linear regression, α = 0.05) displayed decreasing responses with cumulative licks. The scatter plot depicts this comparison in a representative cell with significant adaptation (linear regression, p = 1.7588 x 10⁻⁹, adjusted R2 = 0.7091). Shading represents the 95% confidence interval. See also Fig. S3.
K) The three largest ensembles from a representative animal. Averaged activity of ensemble 1 is excited by sucrose (p < 0.0001) and non-adapting (p = 0.0845), as determined in (I), ensemble 2 is excited (p < 0.0001) and adapting (p = 0.0068), and ensemble 3 is non-selective (p = 0.2041) for sucrose. Licks are plotted as tick marks below ensemble 3. Traces span the complete 23-minute imaging session.
L) For cells in the same ensemble, the average cluster score (the number of times a pair of cells clustered together over 100 iterations of k-means++) during time windows containing measured behaviors is not significantly different than those calculated during time windows that did not contain measured behaviors (n = 212 ensembles across the entire dataset (Fig. 1, 3–5), p = 0.5705, paired t-test).
(M) Spatial distribution of cells in (K).
